A typical 4kW solar system costs around £7,000 installed in 2026 and pays for itself in 12-13 years, followed by roughly a decade of near-free electricity. That is why solar panels are still worth it in 2026 for most UK homes with a suitable roof. This is not a hype piece. I break down the real numbers: install cost, annual savings, payback by system size, and the red flags that make solar a bad investment.
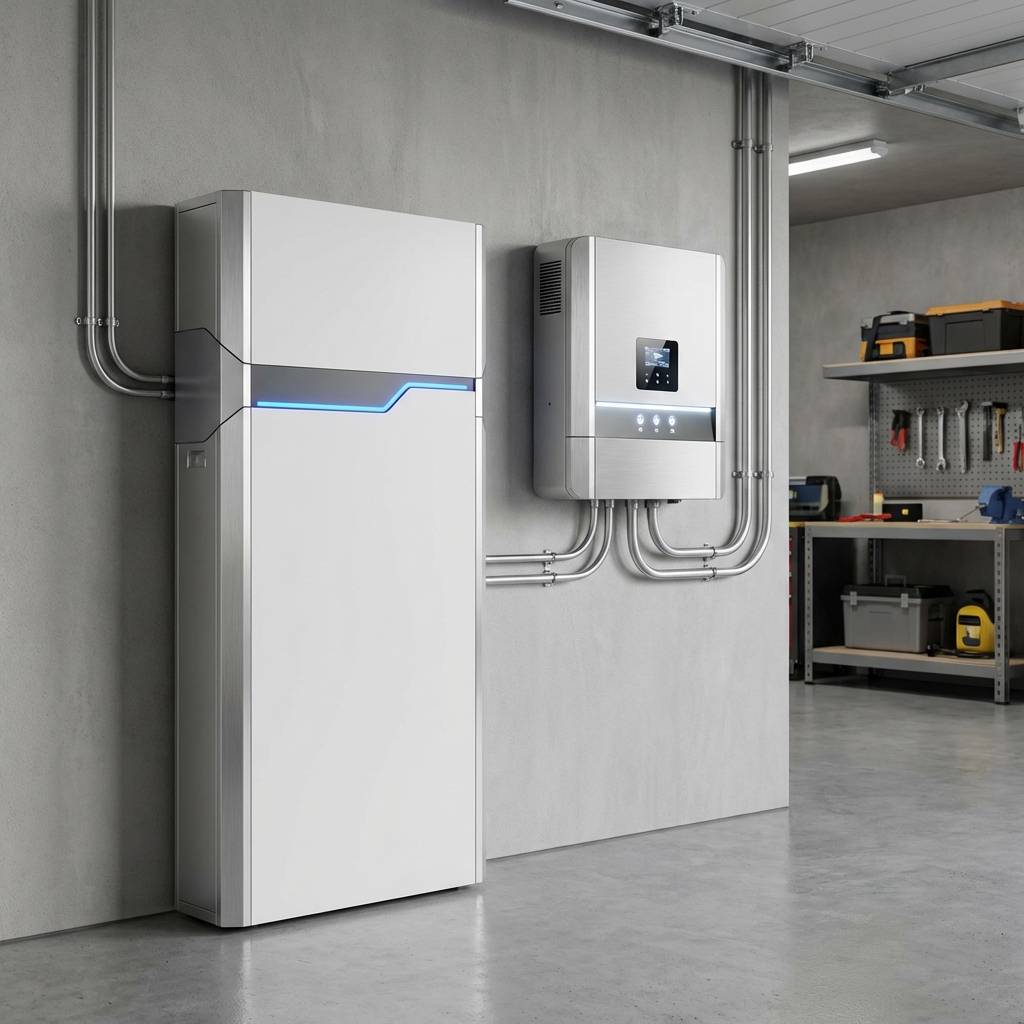
If the idea of installing your own system feels like too much, there is now a managed alternative. Octopus Zero Bills bundles solar, a battery, and a heat pump into a single tariff with no energy bills for up to 10 years. It costs more and you give up control, but for some households the simplicity is worth it.
Around 244,000 UK households installed solar in 2025, a record year. The question is no longer whether solar works, it is whether the sums work for your roof, your usage and your tariff. Every figure below is shown with its working so you can rerun it with your own numbers.
Key Takeaways
- Payback: a 4kW system costs £6,000-8,000, pays back in 12-13 years, then generates £5,000-7,000 in net savings over a conservative 22-year lifespan
- Battery: adding storage costs £3,000-4,500 more but lifts self-consumption from 40-50% to 70-80%, which is where the real savings live
- Timing: 0% VAT until March 2027 and competitive installer pricing after a record 2025 make 2026 a sensible entry point
- Property: solar adds £7,000-10,000 to a typical home’s value and lifts EPC ratings towards C or better
- Skip it if: heavy shading, a north-facing roof, low usage (under 6kWh/day) or moving within 5 years all stretch payback past the point of sense
The 2026 Energy Crisis Context
The January 2026 Ofgem price cap set the average household energy bill at £1,758 per year for dual fuel customers on standard variable tariffs. Electricity specifically costs 27.69p per kilowatt-hour (kWh), with a daily standing charge of 54.75p. For a typical household consuming 2,700 kWh annually, that’s approximately £747 in electricity costs alone, before gas heating.
This represents a marginal 0.2% increase from the previous quarter, but the broader trend is unmistakable: energy prices remain volatile and structurally higher than pre-2021 levels. The price cap has fluctuated dramatically over the past three years, and there’s no guarantee of sustained decreases. According to Ofgem’s January 2026 announcement, wholesale market conditions continue to drive uncertainty.
Against this backdrop, solar panels offer a hedge: once installed, your cost per kWh drops to just 4-5p when amortised over the system’s conservative 22-year lifespan. That’s an 82-85% reduction compared to grid electricity.
Record-Breaking 2025: Why 244,000+ Households Chose Solar
2025 was the UK solar market’s strongest year on record. According to PV Magazine citing Department for Energy Security and Net Zero (DESNZ) data, the Microgeneration Certification Scheme (MCS) recorded 203,125 certified installations by early November 2025, with approximately 244,000 total rooftop installations completed throughout the year. This shattered the previous annual record set in 2011.
Why the surge? Three converging factors:
- Financial Pressure: Sustained high energy prices made the ROI calculation compelling for mainstream homeowners, not just early adopters
- Government Support: 0% VAT on solar panel installations (extended through March 2027) reduced upfront costs by 20%
- Market Maturity: Increased installer competition and improved technology drove prices down while quality and warranties improved
This is not a bubble. It is a rational response to structurally higher energy prices, and when your neighbours’ bills visibly drop, the case makes itself.

The 2026 ROI Breakdown: Real Numbers
Let’s examine two scenarios using current 2026 pricing and conservative assumptions. We’ll use a 4kW system, the most common size for a 2-3 bedroom UK home.
Scenario 1: Solar-Only System
System Specifications:
- 4kW solar panel system (10-12 panels)
- MCS-certified installation
- Total cost: £6,000-8,000 (average £7,000)
Annual Generation: 3,400-3,800 kWh (based on UK average solar irradiance of 850-950 kWh/kWp/year)
Self-Consumption: Without battery storage, a household with someone in during the day uses 40-50% of generated electricity directly (1,360-1,900 kWh). The remainder is exported. If the house sits empty 9 to 5, self-consumption can drop to around 25%, which pushes payback out by several years. Be honest with this number, it is the one that decides your result.
Financial Breakdown:
| Component | Calculation | Annual Value |
|---|---|---|
| Grid Savings | 1,680 kWh × 27.69p/kWh | £465 |
| Export Income (SEG) | 1,720 kWh × 5p/kWh (conservative) | £86 |
| Total Annual Benefit | Savings + Export | £551 |
| Payback Period | £7,000 ÷ £551 | 12.7 years |
| 22-Year Savings | £551 × 22 – £7,000 | £5,122 |
Note: SEG rates vary by supplier. Conservative 5p/kWh used; actual rates range from 3p to 30p+ depending on tariff. See Octopus Energy Export Tariffs for current options.
Scenario 2: Solar + Battery System
System Specifications:
- 4kW solar panel system
- 10kWh battery storage
- Total cost: £10,000-11,000 (average £10,500)
Self-Consumption: Battery storage enables 70-80% self-consumption (2,380-3,040 kWh) by storing excess daytime generation for evening use.
Financial Breakdown:
| Component | Calculation | Annual Value |
|---|---|---|
| Grid Savings | 2,710 kWh × 27.69p/kWh | £750 |
| Export Income (SEG) | 690 kWh × 5p/kWh | £35 |
| Total Annual Benefit | Savings + Export | £785 |
| Payback Period | £10,500 ÷ £785 | 13.4 years |
| 22-Year Savings | £785 × 22 – £10,500 | £6,770 |
Note: Battery degradation factored at 80% capacity after 6,000 cycles (16+ years). Modern LiFePO4 batteries like the Fogstar Energy 16.1kWh offer superior longevity. See our battery storage guide for detailed analysis.
How Long Does Each System Size Take to Pay Back?
Same method, three common sizes. Costs are typical MCS-installed quotes at 0% VAT, generation assumes 850 kWh per kWp on an unshaded roof, and savings use the 27.69p cap rate with a 5p SEG floor. Larger systems export a bigger share of what they generate, so payback does not shorten as much as you might expect.
| System | Typical cost | Annual generation | Annual benefit | Payback |
|---|---|---|---|---|
| 3kW | £5,500 | ~2,550 kWh | ~£415 | ~13.2 years |
| 4kW | £7,000 | ~3,400 kWh | ~£551 | ~12.7 years |
| 6kW | £9,500 | ~5,100 kWh | ~£700 | ~13.6 years |
Roof direction moves these numbers more than system size does. An east/west split generates 70-80% of a south-facing roof’s output, which adds roughly 2-3 years to payback, but it spreads generation across morning and evening when you are actually home to use it. The 3-bed east/west system guide runs the full PVGIS numbers for that layout.
The Battery Necessity Argument
Here’s the critical insight that changes the solar equation in 2026: self-consumption is worth 5-6× more than export.
When you use solar electricity directly, you avoid paying 27.69p/kWh from the grid. When you export it, you receive just 5-15p/kWh (depending on your SEG tariff). This 12-22p/kWh difference makes battery storage financially compelling despite the additional upfront cost.
The problem: solar generation peaks at midday (11am-3pm) when most households use minimal electricity. Peak household demand occurs 4pm-7pm, exactly when solar production drops off. Without battery storage, you’re forced to export cheap solar during the day and buy expensive grid electricity in the evening.
Battery storage solves this timing mismatch. A 10kWh battery captures excess midday generation and releases it during peak evening hours, effectively time-shifting your solar electricity to when you actually need it. This is why adding a battery increases self-consumption from 40-50% to 70-80%, and why the total savings increase by £234 annually despite the £3,500 additional cost.
For households on time-of-use tariffs like Octopus Intelligent Go (7p/kWh off-peak, 29p/kWh peak), the battery advantage becomes even more pronounced. You can charge from the grid overnight at 7p/kWh and discharge during 29p/kWh peak hours, creating a 22p/kWh arbitrage opportunity even without solar generation.
Case Study: The “Force Export” Strategy
One SEC reader took battery arbitrage to the next level, proving just how profitable an optimised setup can be.
The Setup: Started 2024 with a 3.87kW array, then added 3.28kW mid-year (7.15kW total). Combined with battery storage and an Octopus Flux tariff, they implemented a “Force Export” strategy:
- Import Cheap: Charge battery overnight at 7p/kWh
- Run on Battery: Use stored energy during the day
- Export Everything: Send 100% of solar to the grid at 20p+ rates
The Results: In 2025, nearly 4,000 kWh was exported, earning approximately £800 in export payments on top of bill savings from efficient battery use. This isn’t typical, but it shows what’s achievable with smart tariff selection and active system management.
Solar vs. Savings Account: The Investment View
Let’s treat solar as a financial product. If you have £10,500 in savings, how does it compare to a solar+battery system?
Option A: Cash ISA (5%) = £525/year
Option B: Solar + Battery = £785/year (baseline) to £1,000+/year (optimised)
Tax-Free Advantage: Solar savings are effectively tax-free. A 40% taxpayer would need over £1,300 gross to net £785, making solar’s effective return 12-13%.
Want to see these numbers in action? Read about my real solar panel payback results after 16 months, including a breakdown of the three income streams that delivered £1,342 in savings from a DIY install.
The Cost of Inaction
| Year | Do Nothing | Solar + Battery |
|---|---|---|
| Start | £0 | -£10,500 |
| Year 5 | -£9,300 | -£6,200 |
| Year 10 | -£20,500 | -£1,100 |
| Year 15 | -£33,000 | +£5,000 |
Real World Proof: 2 Years of Data
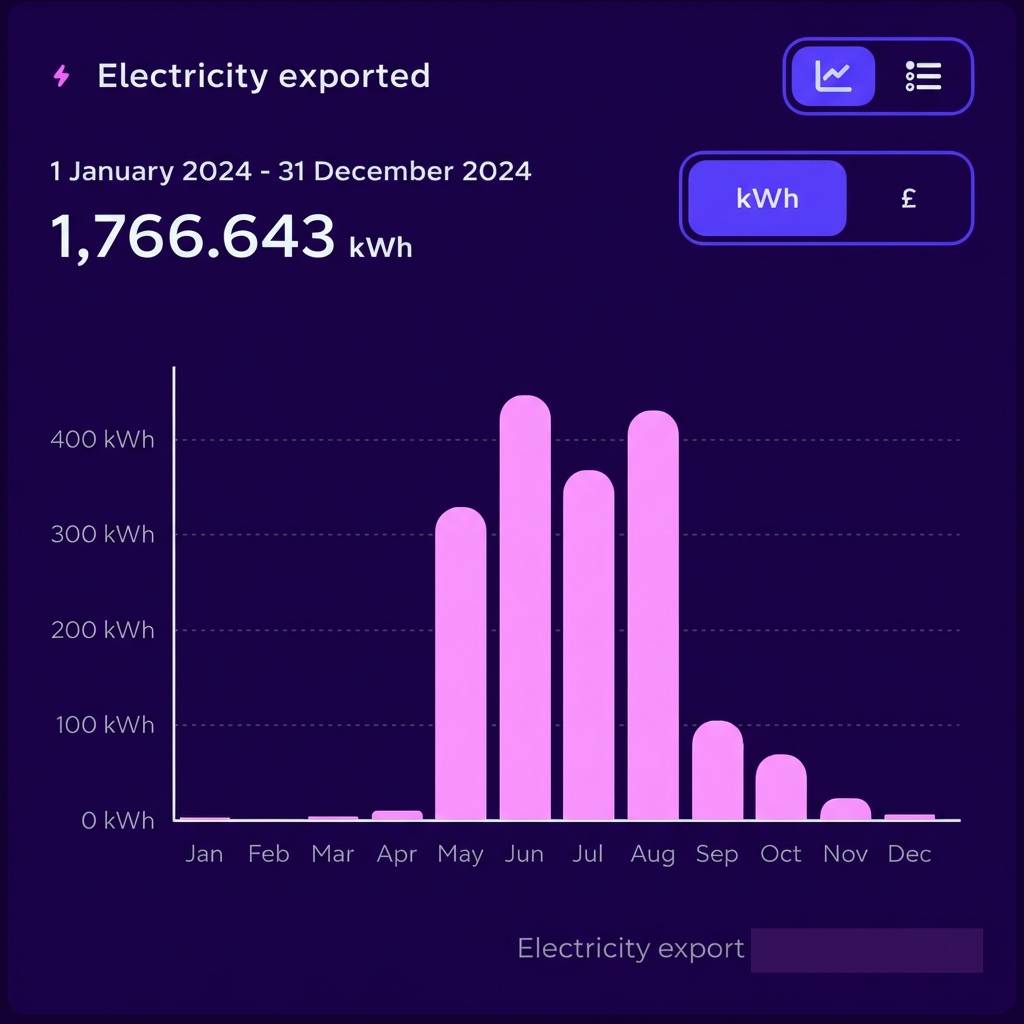
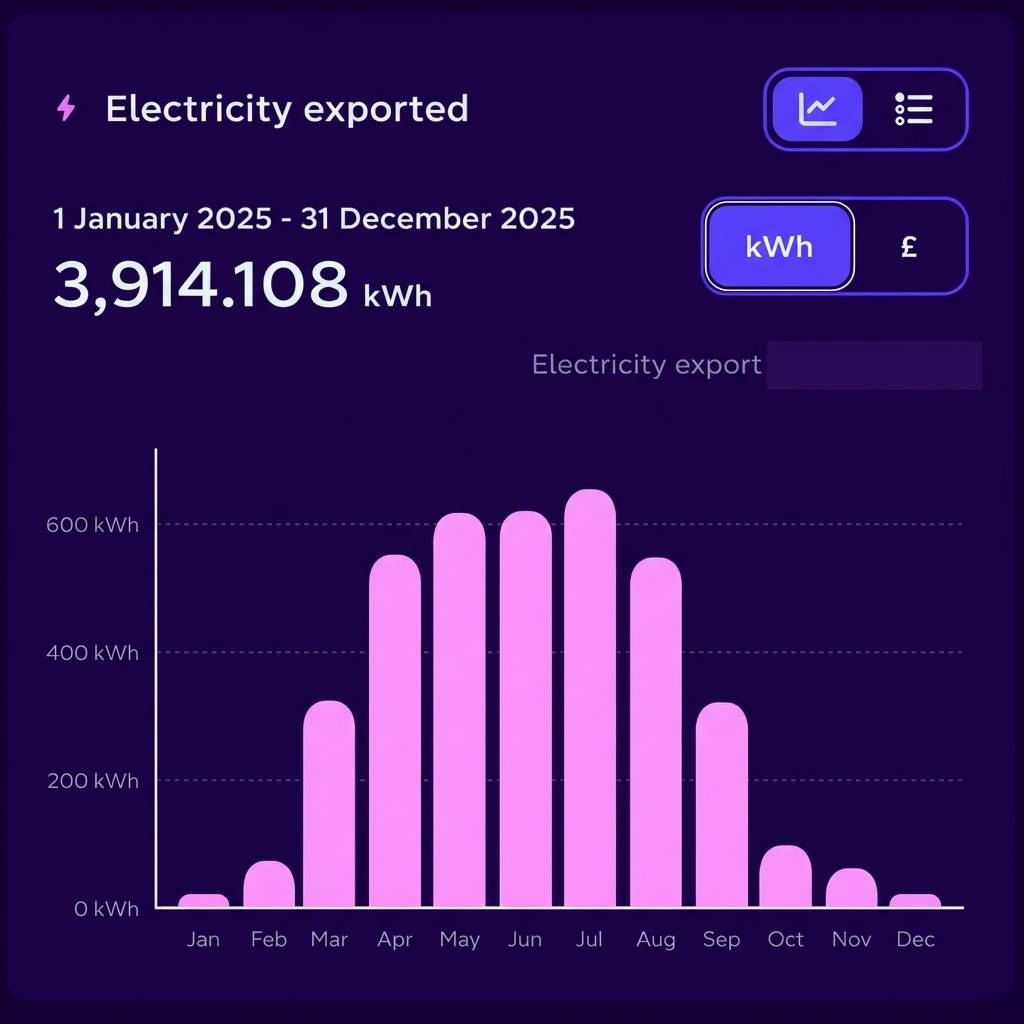
Theory is one thing; real-world data is another. I analysed two years of electricity usage data from a UK household with an electric vehicle (EV) to see the impact of solar and battery storage.
The “U-Shape” of Savings
Look at the usage graphs below from Octopus Energy. The pattern is striking: a distinct “U-shape” where grid consumption drops to near-zero during the sunnier months (April to September).
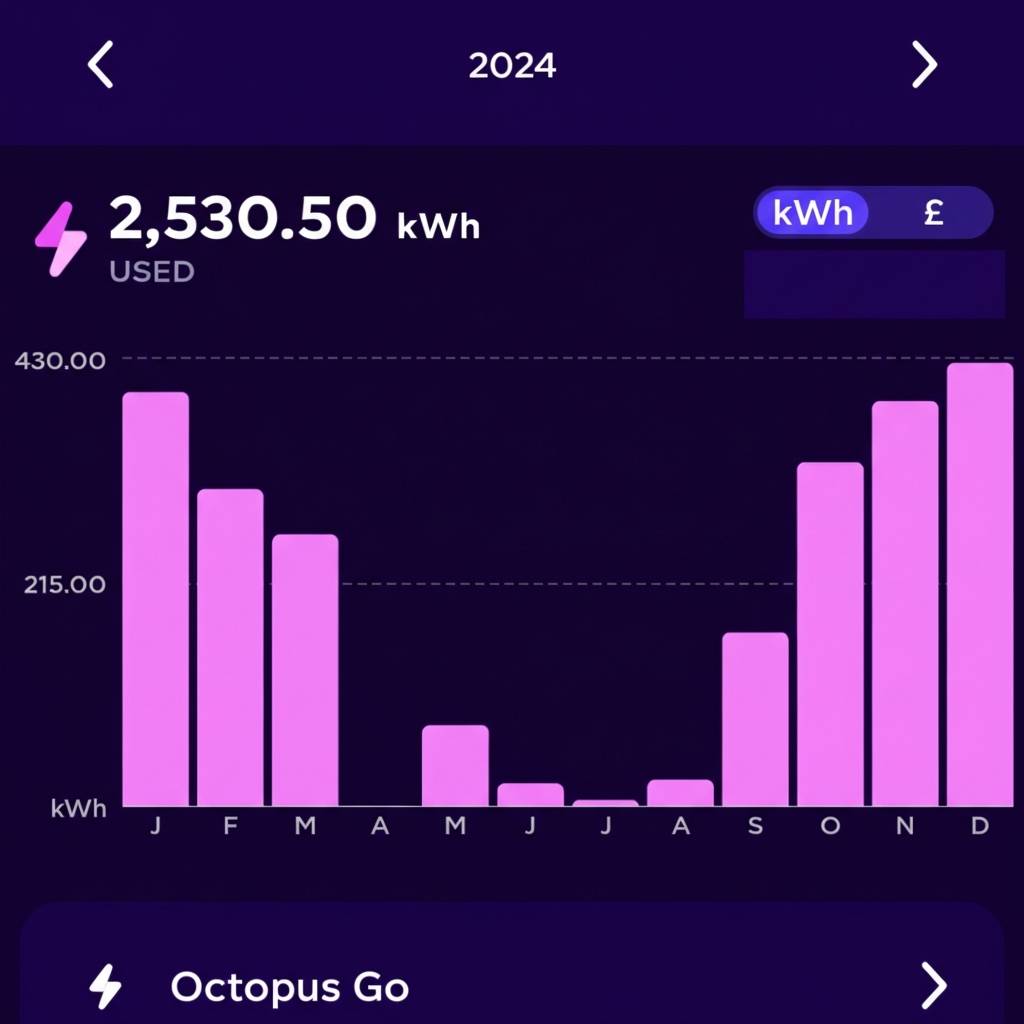
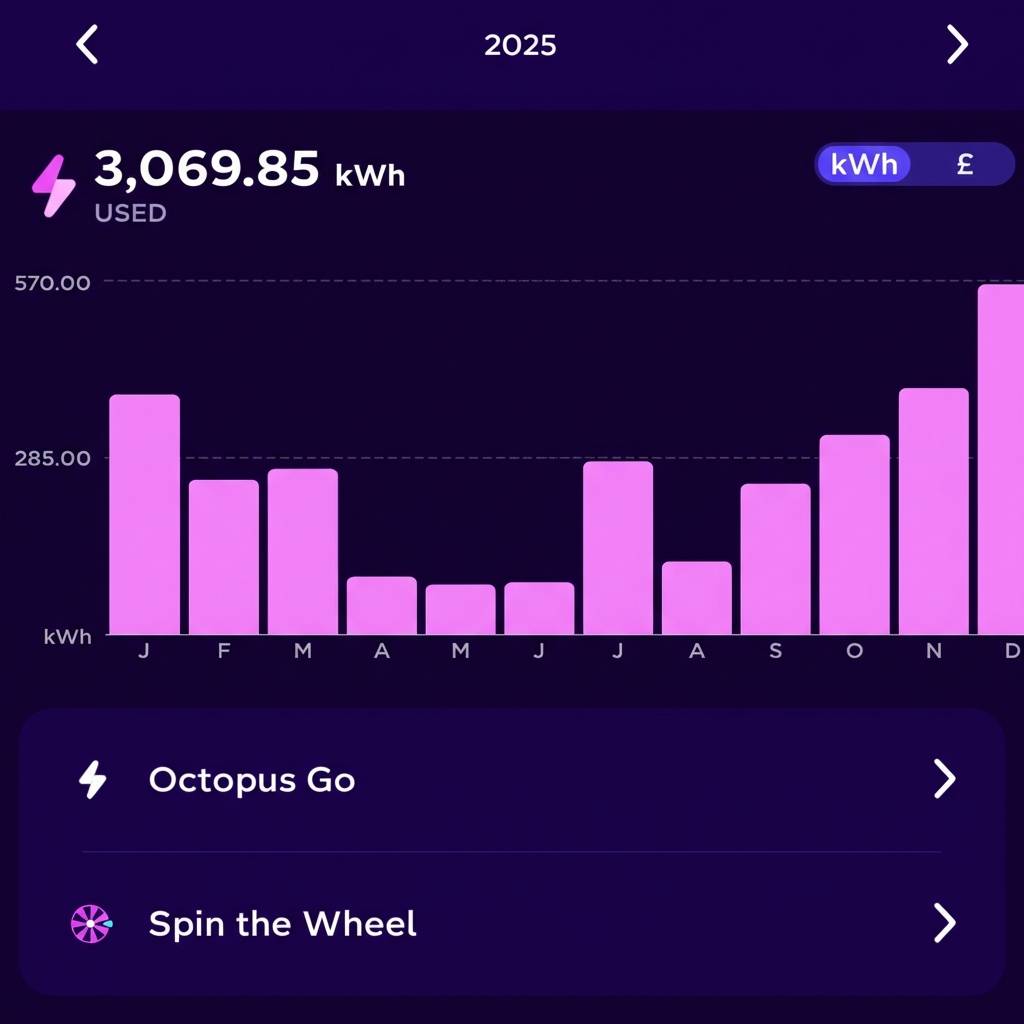
In both 2024 and 2025, grid usage plummeted in late spring and summer. During these months, the solar array covers almost all household needs, plus charging the battery for evening use. The only meaningful grid draw is in deep winter (November-February) when solar generation is naturally lower. Even then, the battery allows charging at cheap off-peak rates to offset expensive peak usage.
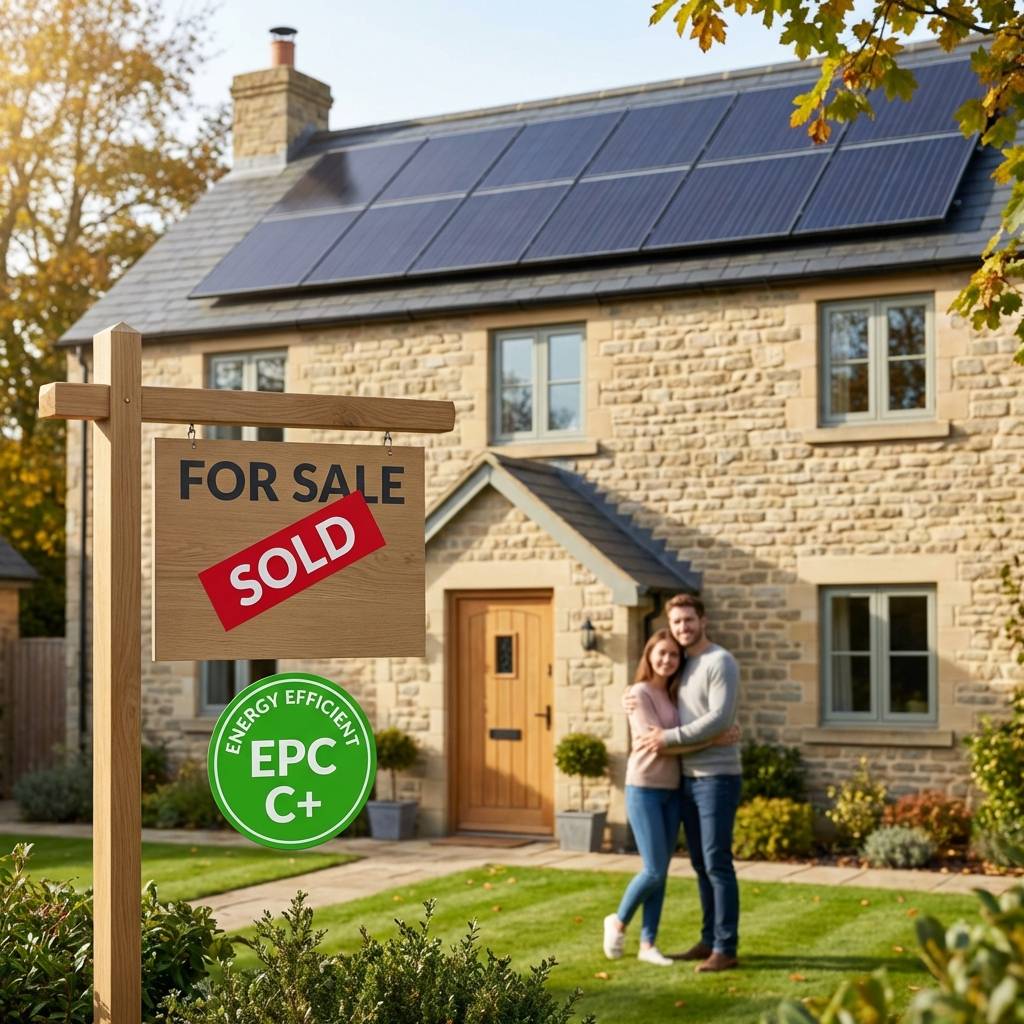
Green Mortgages & EPC Ratings: The Property Value Angle
Solar panels deliver financial benefits beyond electricity savings. Two property-related advantages are increasingly relevant in 2026:
EPC Rating Improvement
A typical 4kW solar system adds up to 15 points to your Energy Performance Certificate (EPC) rating, potentially moving a property from D to C or C to B. This matters because:
- Rental Regulations: From 2026, all new tenancies in England and Wales require a minimum EPC rating of C. Landlords face penalties up to £30,000 for non-compliance. Solar panels offer a cost-effective path to meeting this requirement.
- Property Value: Homes with higher EPC ratings command a premium. Properties rated A or B sell for at least 14% more than lower-rated equivalents, according to Rightmove analysis. Improving from F/G to C could add nearly 20% to property value.
- Buyer Demand: 71% of homebuyers factor EPC ratings into their decision-making, and many are willing to pay more for energy-efficient homes. Solar panels signal lower running costs and smart energy independence, both increasingly important to buyers.
Direct Property Value Increase
Independent of EPC improvements, solar panels add 4-14% to property value. For a typical £200,000 home, that’s £8,000-28,000 in added value. Conservative estimates suggest a 4kW system adds £7,000-10,000, potentially recovering your entire installation cost immediately upon sale.
Properties with solar installations also sell faster. Lower running costs and the appeal of “free” electricity create competitive advantages in the housing market, particularly as energy costs remain a top concern for buyers.
Green Mortgage Access
Major lenders including Barclays, NatWest, Virgin Money, and Nationwide offer green mortgages with preferential rates for energy-efficient properties. These typically require EPC ratings of A or B, which solar panels help achieve. Benefits include:
- Lower interest rates (typically 0.1-0.25% reduction)
- Cashback offers (£500-2,000)
- Higher borrowing limits
For a £200,000 mortgage, a 0.2% rate reduction saves £400 annually, £10,000 over a 25-year term. Combined with solar electricity savings, the total financial benefit becomes substantial.
The entry-level bet: plug-in solar at £350
The ROI numbers above assume a 4 kWp installed rooftop system. That is not the only entry point any more. Plug-in-scale solar, with BS 7671 Amendment 4 in force since 15 April 2026, is a two-panel 1 kWp setup that mounts on a south-facing fence, garden wall or shed end. Total hardware runs £350-400.
At typical UK yield (800-1,000 kWh/year from 1 kWp south-facing at 28° per PVGIS) and decent self-consumption (60-70% because the generation matches daytime baseload), annual savings land at £150-200. That is a 2-3 year payback on hardware (at the 27.69p/kWh Ofgem cap as of April 2026; adjust your consumption and self-use profile in our calculator). No MCS install fee, no scaffolding, no G99 application, just a 5-minute G98 notification to your DNO and a hardwired tie-in to the consumer unit. The ROI per pound spent is actually higher than a full rooftop install because the marginal cost is so much lower. The ceiling is lower too: you will not offset a heat pump or an EV with a plug-in kit. But if the question is “is solar worth starting at all?”, the answer now starts at £350, not £5,000.
When Solar ISN’T Worth It: Honest Limitations
While we frequently debunk common solar myths claiming the technology doesn’t work in the UK, solar panels aren’t a universal solution. Here are scenarios where the ROI truly doesn’t make sense:
Poor Solar Conditions
- Heavy Shading: Trees, tall buildings, or chimneys that shade your roof for hours each day reduce generation by 30-70%. Power optimisers can mitigate partial shading, but severe shading makes solar uneconomical.
- North-Facing Roofs: In the UK, south-facing roofs are optimal. North-facing installations generate 40-50% less electricity, extending payback periods beyond 20 years. East or west-facing roofs are acceptable (70-80% of south-facing output), see our 3-bed east/west roof system guide for specific numbers. If you have a south-facing roof on a larger property, the 4-bed south-facing system guide covers panel counts, inverter sizing, and ROI for bigger homes. North-facing is generally not viable.
- Roof Condition: If your roof needs replacement within 5-10 years, address that first. Removing and reinstalling solar panels costs £1,000-2,000, eroding your ROI.
Low Consumption Households
If your household uses less than 6kWh per day (2,190 kWh annually), you won’t consume enough electricity to justify a 4kW system. Your self-consumption percentage drops, forcing you to export more at unfavourable rates. Consider a smaller 2-3kW system instead, or wait until your consumption increases (e.g., when adding an electric vehicle or heat pump).
Short Ownership Horizon
With 12-13 year payback periods, solar panels require long-term ownership to realise the full benefit. If you’re planning to move within 3-5 years, the property value increase may not fully compensate for installation costs, especially if buyers don’t value solar as highly as expected.
Exception: If you’re confident solar will add £7,000+ to your sale price (which data suggests is likely), the investment can still make sense even with shorter ownership.
Structural Limitations
- Listed Buildings: Planning restrictions may prohibit or severely limit solar installations
- Flat Roofs: Require mounting frames that increase costs and may not be structurally suitable
- Asbestos Roofs: Require specialist removal before solar installation, adding £5,000-15,000 to project costs
2026 Government Support and Incentives
Several schemes reduce the upfront cost of solar installation in 2026. For full details on each scheme, eligibility and how to apply, see our UK Solar Panel Grants and Incentives 2026 guide. Here is a summary:
0% VAT on Installations
The government’s 0% VAT rate on energy-saving materials, including solar panels and battery storage, remains in effect until March 2027. This reduces installation costs by 20% compared to the standard VAT rate, saving £1,200-1,600 on a typical £6,000-8,000 system.
Smart Export Guarantee (SEG)
The SEG requires larger energy suppliers to pay for surplus electricity exported to the grid. Rates range from 3p to 30p/kWh depending on supplier:
- Standard rates: 3-5p/kWh (most suppliers)
- Competitive rates: 15-20p/kWh (Good Energy, EDF, OVO for customers)
- Premium rates: 25-30p/kWh (Octopus Flux peak hours, requires battery)
Eligibility requires MCS certification and a smart meter capable of half-hourly readings. See our Octopus Energy Export Tariffs guide for detailed comparisons.
ECO4 Scheme
The Energy Company Obligation (ECO4) scheme provides funding for low-income households and properties with EPC ratings of D or below. Eligible homeowners can receive up to 100% funding for solar panel installation. The scheme concludes in March 2026, so act quickly if you qualify.
Eligibility criteria include receiving certain benefits (Universal Credit, Pension Credit, etc.) or having a household income below £31,000. Check with your energy supplier or visit the official ECO4 guidance for details.
Next Steps: Making Your Decision
If you’ve determined solar makes financial sense for your situation, here’s your action plan:
1. Assess Your Roof and Consumption
- Review your electricity bills to determine annual consumption
- Check roof orientation (south-facing is optimal, east/west acceptable). See our system guides by roof type for sizing recommendations
- Identify potential shading issues (trees, buildings, chimneys)
- Verify roof condition and age (should last 10+ years)
2. Get MCS-Certified Quotes
Only use MCS-certified installers. MCS certification is required for:
- SEG payment eligibility
- Manufacturer warranty validity
- Building regulations compliance
Get at least three quotes to compare pricing, equipment quality, and warranty terms. Expect quotes to include:
- Panel specifications (wattage, efficiency, warranty)
- Inverter type (string, micro, or hybrid)
- Installation timeline and scaffolding requirements
- Projected annual generation and savings
3. Consider Battery Storage
As demonstrated in our ROI analysis, battery storage improves returns by lifting self-consumption from 40-50% to 70-80%. While adding £3,000-4,500 to upfront costs, batteries deliver:
- Higher annual savings (£234+ additional per year)
- Backup power during outages
- Time-of-use tariff optimisation
- Future-proofing for EV charging and heat pumps
Read the battery storage guide for detailed analysis and product recommendations.
4. Explore Financing Options
If upfront costs are prohibitive, consider:
- Green loans: Interest-free or low-interest loans specifically for energy efficiency improvements
- Home improvement loans: Personal loans with competitive rates for solar installations
- Remortgaging: Releasing equity to fund solar installation (only if you’re already remortgaging)
Ensure loan interest rates don’t exceed your annual savings percentage. For example, if your system delivers 7.9% annual return (£551 on £7,000), don’t accept loans above 7% APR.
5. Plan for Future Expansion
Even if you’re starting with solar-only, choose a hybrid inverter that supports battery addition later. This future-proofs your investment and allows you to add storage when prices drop further or your budget allows.
Similarly, if you’re planning to add an electric vehicle or heat pump in the next 5 years, size your system to accommodate that increased consumption. It’s more cost-effective to install a larger system initially than to expand later.
Worked Examples for Every Roof Type
ROI figures only land when you see them on a specific house. Five worked examples with real panel counts, inverter models, battery sizing, and payback numbers:
- 2-bed south-facing. The simplest case.
- 3-bed east/west. Better demand-curve match than south for most families.
- 3-bed north-facing. When it pays back and when to skip it.
- 4-bed south-facing. The premium case.
- 4-bed NW/SE split. Dual-MPPT, asymmetric loading.
Solar Payback FAQs
How long do solar panels take to pay for themselves in the UK?
12-13 years for a typical installed 4kW system at January 2026 prices. High daytime usage, a battery, or a strong export tariff can pull that in. A DIY install changes the equation entirely: roughly half the upfront cost means payback in 6-7 years. My own £9,000 DIY system returned £1,342 in its first 16 months.
What is the payback period for a 4kW solar system?
About 12.7 years: £7,000 installed, returning £551 a year (£465 in avoided grid electricity plus £86 in export at a conservative 5p/kWh). Your roof’s pitch and direction change the generation side of that sum, so check yours with the solar panel angle calculator before trusting any quote’s projection.
Are solar panels worth it on an east/west roof?
Yes, with payback around 2-3 years longer than a south-facing roof. East/west panels produce 70-80% of south-facing output, but generation lands in the morning and evening when most households actually use power, so a higher share gets self-consumed at 27.69p rather than exported at 5p. The east/west system guide has the full breakdown.
What are the main advantages and disadvantages of solar panels?
Advantages: £550-785 a year off a typical bill, electricity at 4-5p/kWh over the system’s life, £7,000-10,000 added to property value, and a better EPC rating. Disadvantages: £6,000-8,000 upfront, a 12-13 year wait to break even, weak returns on shaded or north-facing roofs, and scaffolding or roof work disruption during install. The limitations section above covers the deal-breakers in detail.
Are solar panels worth it if I might move house?
Only if you expect to stay 5+ years, or you are confident of recovering the cost in the sale price. A 4kW system adds £7,000-10,000 to a typical home’s value, which roughly covers the install cost, but that premium is not guaranteed in every local market. Inside 3 years, the maths rarely works.
Conclusion: The 2026 Verdict
Are solar panels worth it in 2026? For most UK homeowners with suitable roofs and average consumption, yes, emphatically.
High electricity prices (27.69p/kWh), competitive installation costs (£6,000-8,000 for 4kW), 0% VAT and better hardware all point the same way. Payback periods of 12-13 years deliver 9-10 years of near-free electricity worth £5,100-6,800 in total net savings, plus property value increases of £7,000-10,000.
Adding battery storage lifts self-consumption from 40-50% to 70-80%, opens up time-of-use tariff arbitrage, and keeps the lights on through power cuts. The additional £3,500 investment delivers £234+ in extra annual savings and positions your home for future electrification (EVs, heat pumps).
The 244,000+ households that installed solar in 2025 were not chasing environmental virtue. They were doing the same sums you have just read. With energy prices remaining structurally high and volatile, solar panels offer the only way to lock in 4-5p/kWh electricity costs for the next 22 years.
The question isn’t whether solar makes sense in 2026. It’s whether you can afford to keep paying 27.69p/kWh when you could be paying 3-5p/kWh instead.
Ready to take the next step? Explore our guides on choosing the right inverter, battery storage options, and DIY installation to maximise your savings.
