
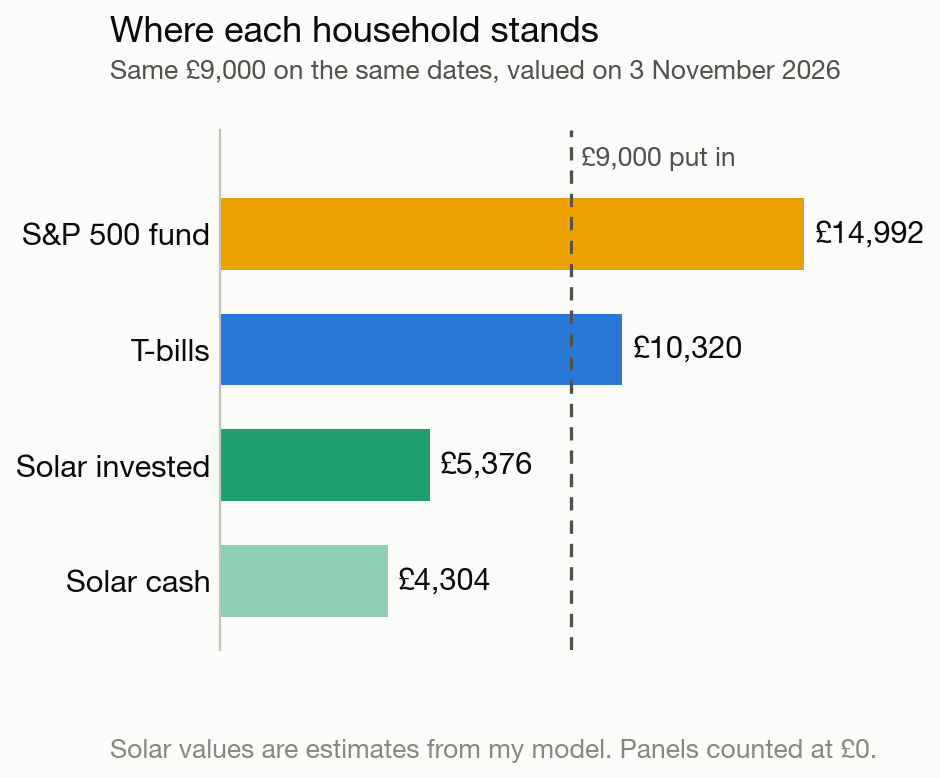
No. On money alone, the stock market beat my solar panels. I spent £9,000 on solar. I paid £6,982 in May 2023 and £2,018 in May 2024. An S&P 500 fund holds shares in about 500 large American companies. The same two payments in that fund, on the same dates, were worth £14,992 on 3 November 2026. By my estimate, my panels saved me about £4,300 over the same time.
T-bills did better than solar too. A T-bill is a short loan to the UK government. The same £9,000 in T-bills was worth about £10,300. That is about £1,300 of interest, and the £9,000 is still there. I would still buy solar again, for three reasons.
My video below goes through the whole comparison. It shows the charts, the bills, and my answer to the question “would I do it again?”
How did I compare solar with the stock market?
I set up four imaginary households. Each household gets the money on the same dates as I paid it. That is £6,982 on 31 May 2023 and £2,018 on 31 May 2024. I then value each household on 3 November 2026. That is the last day with a final fund price in my data.
- The fund household buys an S&P 500 index fund, Vanguard VUAG. An index fund copies a list of companies instead of picking them. The fund is priced in pounds. This household keeps paying its electricity bills at the price cap. The price cap is the limit on the price per unit that suppliers can charge on a standard tariff.
- The T-bill household buys six-month UK Treasury bills. When a bill repays, the household buys a new one. This household also pays its electricity bills at the price cap.
- The solar cash household does what I did. It buys my solar system and battery. It keeps the money that the system saves as cash.
- The solar invested household buys the same solar system. Every month, it puts the money that the system saves into the same S&P 500 fund.
All four households use the same amount of electricity as my home used in 2025. That is about 4,910 kWh a year, and one kWh is one unit on your bill. Gas costs the same for all four households, so I leave it out. I treat every investment as if it sits in an ISA. An ISA is a UK account where you pay no tax on what you earn, so no household pays tax.
The fund values are real market prices. The T-bill and cash ISA values come from published Bank of England rates. The solar values are estimates from my own model. The model uses my 2025 bills, the energy counters on my inverter, and published tariff rates. The last section lists the limits of my numbers.
How do a fund, a T-bill and solar pay you back?
A fund pays you through growth. A T-bill pays you through interest. Solar pays you through bills that you do not have to pay.
- An S&P 500 fund holds shares in about 500 large American companies. The fund grows with their share prices, with their dividends, and with the pound-to-dollar rate. A dividend is a share of a company’s profit that it pays out to its owners. The fund can also fall.
- A T-bill is a short loan to the UK government. You buy it for less than its face value, which is the amount it repays. After six months you get the full face value back. The difference is your return.
- Solar pays no interest. It pays you through lower electricity bills and export payments.
Solar saves me money in three ways. First, the house uses the power that the panels make, so I do not buy that power. Second, I sell the power that the house does not use to the grid. This is called export. Third, my battery charges from the grid at night at a cheap rate, and the house runs from the battery during the day. That leaves more solar power to sell.
How much did solar save me in 2025?
About £1,516, by my estimate. 2025 was the first full year with my whole system. It has 9 panels on the garage roof and 8 more on a solar gazebo. Without solar, my 4,910 kWh would have cost about £1,441 at the 2025 price cap. That figure includes the standing charge, which is the fixed daily fee on the bill. With solar, my import costs (the power I bought from the grid) and my standing charges for 2025 were £75 less than my export payments. So my electricity cost me nothing in 2025, and I ended the year £75 in credit.
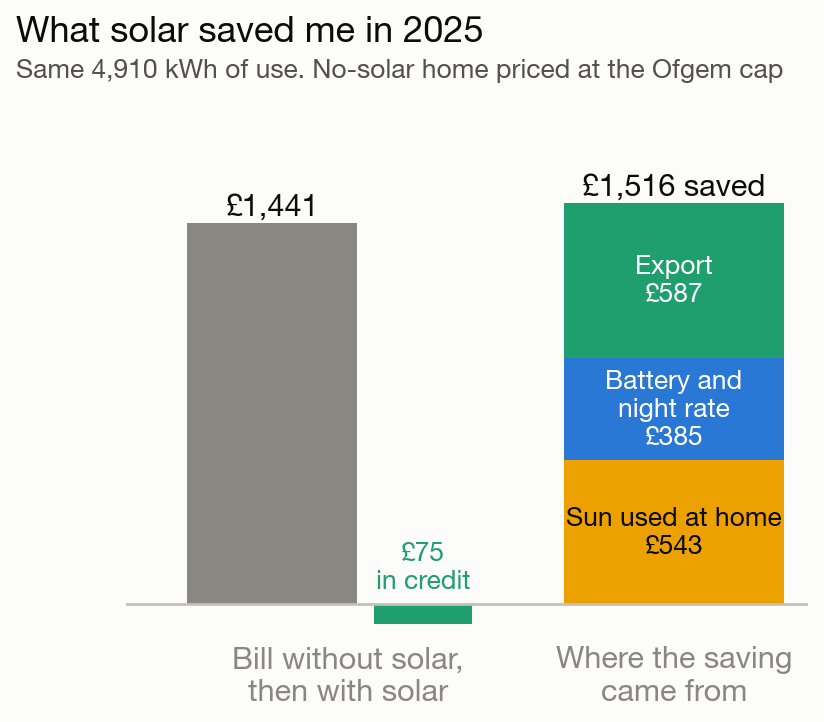
The £1,516 splits into three parts, one for each way that solar saves me money.
- Sun used at home: about £543 (36%). The house used 2,142 kWh of solar power, either directly or through the battery.
- Battery and night rate: about £385 (25%). The battery took 2,418 kWh from the grid at 8.5p a unit on Octopus Go, a cheap night tariff. It gave the house 2,116 kWh during the day.
- Export: about £587 (39%). I sold 3,914 kWh to the grid at 15p a unit.
In winter, the battery can save more than the panels. In January 2026 my panels made only 100.5 kWh. The battery saved at least £40.88 that month, and the panels saved at most £25.07.
My payback article gives £1,668 for 2025. That figure values every unit that I did not buy at 29.62p. Here, a home without solar pays the 2025 price cap. The cap was lower, about 25p a unit. This article also counts the energy lost in the battery. The lower price and the battery loss each make the saving smaller. I use the price cap because a home with no battery has no reason to choose a night tariff.
What return did solar need to beat the S&P 500?
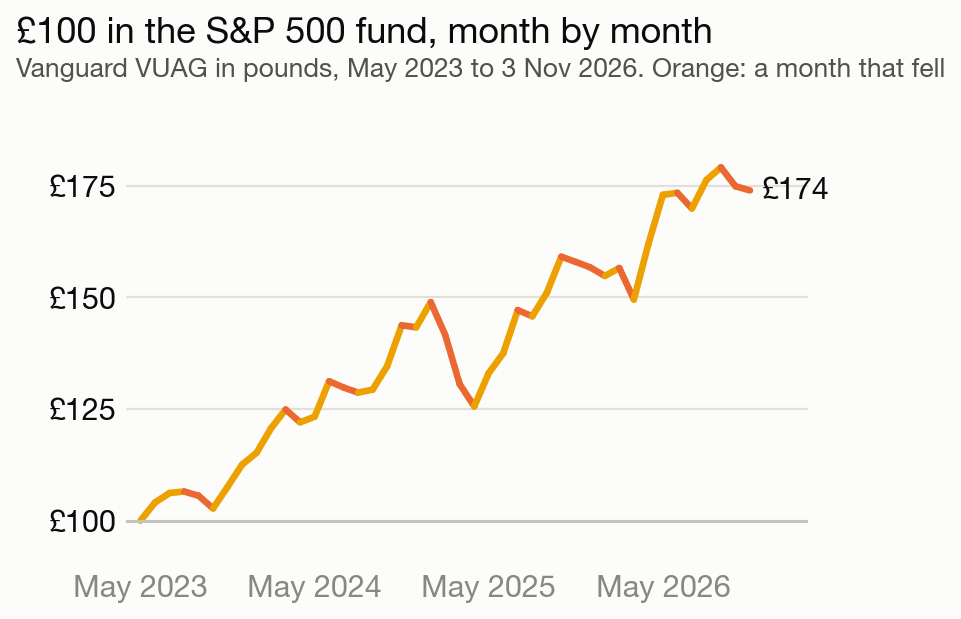
About 17.5% a year. From 31 May 2023 to 3 November 2026, the S&P 500 fund grew 74%. Every £100 became £174. That growth is the same as earning about 17.5% a year. This yearly rate is the fund’s annual return. A FTSE 100 fund, which holds the 100 largest companies on the London stock market, grew 60% over the same time. That is about 14.8% a year. T-bills earned about 4.4% a year.
My panels did not reach that rate in their first year. My first 16 months saved £1,342. I adjust that to the same electricity use as 2025, and it comes to about £914 a year. That is about 13% of the £6,982 that the first system cost. This is an estimate. The 16 months also include 5 months with the gazebo panels.
In May 2024 I added the gazebo panels with their own small inverters. That raised the peak power of my panels from 3.87 kW to 7.15 kW. In 2025, the £1,516 saving was about 17% of the full £9,000. At first look, 17% is close to the fund’s 17.5%.
Why is the gap so big when the returns look so close?
Because a fund keeps your £9,000, and solar spends it. The fund household still owns its £9,000 and all of the growth. It can sell the fund and take all of the money back.
My £9,000 became equipment that is bolted to my house. In my model, the panels have no resale value. So the first £9,000 that my panels save only pays back what I spent. Solar makes a profit only after that.
Today, the solar cash household is still about £4,700 short of its £9,000. At the current rate, it gets the whole £9,000 back around January 2030. That date is an estimate. My payback article expects the money back in 2028 or 2029. This article compares every year’s saving with the price cap. The savings are smaller, so the date is later.
A saving of 17% a year is not a return of 17% a year. In my payback article, I compared my 2025 saving with a cash ISA rate, which is the interest rate on a tax-free savings account. That comparison leaves out one fact. The ISA keeps your money, and solar does not.
The second cause of the gap is timing. Shares grew fast in this period, 74% in total. The fund still fell on the way. On 9 April 2025 it was 21% below its highest price, and in its worst month, March 2025, it lost 7.8%.
The table below lists every option that I checked, with the same money and the same dates.
| Option | Value on 3 Nov 2026 | Return a year | Months down (of 42) |
|---|---|---|---|
| S&P 500 fund (fund household) | £14,992 | 17.5% | 17 |
| FTSE 100 fund | £14,001 | 14.8% | 12 |
| High-yield bond fund | £10,922 | 6.5% | 10 |
| T-bills, six-month (T-bill household) | £10,320 | 4.4% | 0 |
| Cash ISA, 1-year fixed | £10,288 | 4.3% | 0 |
| Cash ISA, variable rate | £9,666 | 2.3% | 0 |
| Solar invested household | £5,376 | not comparable | see reason two |
| Solar cash household | £4,304 | not comparable | see reason two |
Every option in the table ended with more money than both solar households.
Would I buy solar again?
Yes. The money result points the other way, but the table leaves out three things.
Reason one: the panels keep cutting the bill
The fund household and the T-bill household still pay their full electricity bill. In my model, that bill is about £1,400 a year. From June 2023 to October 2026, it adds up to about £5,000.
The solar cash household’s £4,304 is the part of those bills that it did not pay. The solar invested household has the same savings plus £1,072 of fund growth. The solar values already include these bills, so I do not subtract them from the fund household’s £14,992.
The bill comes again every year, and the solar households keep their panels. So here is a fairer test. Suppose the fund household and the T-bill household buy the same solar system today. To keep the sum simple, I give the system the same £9,000 price.
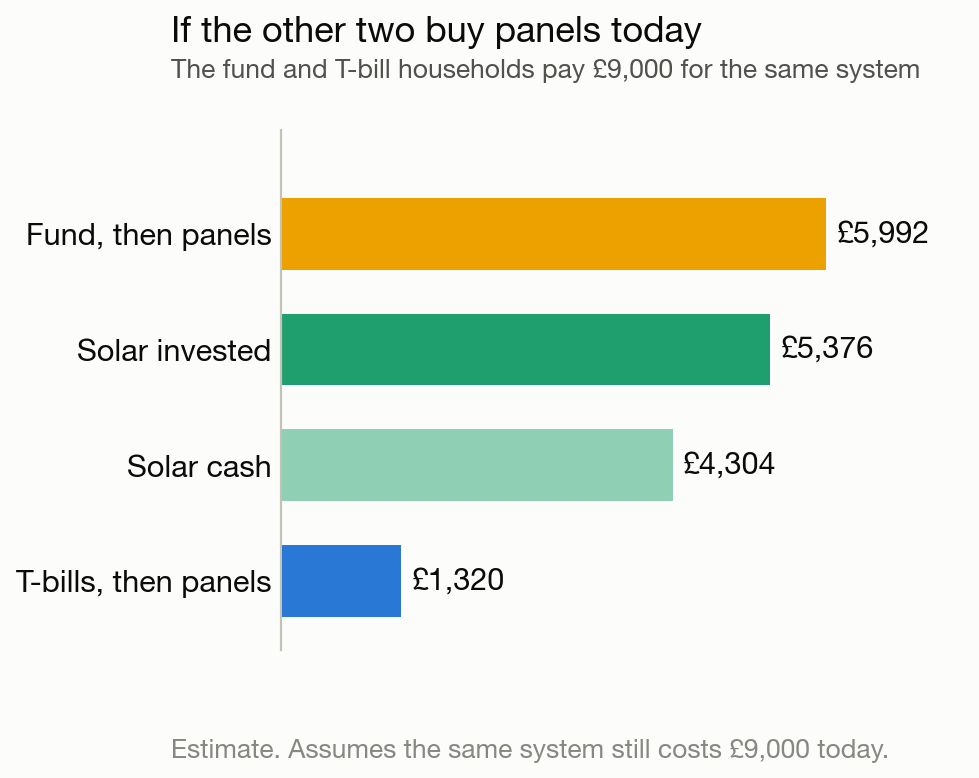
The fund household is left with £5,992. That is only £616 more than the solar invested household. The T-bill household is left with £1,320. The solar cash household is £2,984 ahead of it, and the solar invested household is £4,056 ahead.
This test is not perfect. My panels are three years older than new ones. Parts also cost less today. In my payback article I estimate that the same parts now cost about £1,783 less. That is about 20% of the £9,000. So a real purchase today would leave the fund household and the T-bill household with more money than the chart shows.
Reason two: solar saves money every month
My panels made power in every month from June 2023 to October 2026. The lowest month on my main inverter was December 2023, with 39.6 kWh. I know my tariff for 25 full months, and solar saved money in each of them. The lowest saving among those months was in February 2025, at £27.88 or more. For 15 earlier months, I have no record of my Octopus tariff, so I cannot prove the result for them.
Over the same 42 months, the S&P 500 fund lost value in 17 of them. If you have a mortgage or a fixed income, a saving that arrives every month is easier to plan around.
T-bills were just as steady. The T-bill household had no month in which its value fell. So a steady monthly saving is not a reason to choose solar over T-bills. The reason to choose solar is the price of electricity.
Reason three: solar protects you from electricity price rises
You can choose not to buy T-bills. Most of us cannot choose to stop buying electricity.
In February 2023, the full price on my electricity bill was 67.26p a unit, including VAT. The government’s Energy Price Guarantee paid about half of it. If prices rise that far again, the government may not help next time.
My home buys about 3,070 kWh a year from the grid. A home without solar buys about 4,910 kWh. So if the price of grid electricity rises by 10p a unit, my saving rises by about £184 a year.
If the full February 2023 price came back, my yearly saving would rise to about £2,300. That is an estimate. It assumes that my export rate stays at 15p.
A fund does not pay you more when energy gets expensive, and shares can fall in the same year. In 2022, the S&P 500 index fell 19% in dollars. Solar is the one part of my money that saves more when electricity costs more.
When does solar catch up with the stock market?
Not for years. By my estimate, the solar cash household gets its £9,000 back around January 2030. The solar invested household catches the fund household around 2035 to 2039.
These dates are estimates. They assume that my panels and battery keep working, that the yearly saving falls by 0.5% a year, and that the yields (the interest rates on T-bills and bonds) stay at their November 2026 levels.
- The solar cash household gets its £9,000 back around January 2030.
- The solar invested household passes the T-bill household between September 2029 and July 2030. The date depends on whether its fund grows at 10%, 7% or 5% a year.
- The solar cash household passes the T-bill household around July 2033.
- The solar invested household catches the fund household in about 9 more years if both grow at 5% a year, or about 13 more years if both grow at 10% a year. That is about 2035 to 2039.
So solar pays back over years, not months.
Should you buy solar or invest the money?
Invest first, and buy solar later if you plan to stay in your home for years. This is my own view from my own numbers, not financial advice.
| Your situation | What I would do |
|---|---|
| You have not started to invest yet | Start with shares, not solar. |
| You may need the money back within a few years | Keep it in T-bills or a cash ISA. Solar cannot give the money back. |
| You already invest, and you will stay in your home for years | Solar can sit next to your shares as a second, steady investment. |
For me, as a family man in a house where I plan to stay, solar is a second investment next to my shares. It saves money every month, and it protects my bills from price rises. It will not grow your money like the stock market.
You can own both. The solar invested household is already £1,072 ahead of the solar cash household. If you buy solar, invest the money that it saves each month.
What are the limits of my numbers?
My numbers come from a model, so they rest on the assumptions below. Each one can move the result.
- The start date. A different start gives a different gap. From 1 May 2023, one month earlier, the same fund grew 78% instead of 74%.
- Resale value. I count the panels at £0. I have no figure for what they add to the price of the house.
- Repairs. The model assumes that nothing breaks. A new inverter or battery would move every catch-up date later.
- The same use. All four households use 4,910 kWh a year. Before solar, my home used about 2,750 kWh a year, by my estimate. Since then my family has grown, and we use more power for convenience. The 4,910 kWh comes from my 2025 balance sheet. The load counter on my inverter reads about 18% higher.
- The yearly savings. Only 2025 comes from a full set of bills. For the other years, I scale my own yearly figures to the same electricity use, and I spread each year evenly over its months.
- Rates. Cash ISAs use Bank of England average rates, not the best rates on offer. For T-bills, I also tried the average tender yields of the Debt Management Office, which sells UK government debt. They give about £10,400 instead of £10,300.
- Power cuts. I give solar no value for backup power. A grid-tied system switches off in a power cut, unless an installer has set up a backup output on the inverter. Here is how to check yours.
To test your own numbers, start with the solar savings calculator in my payback article. Then compare where solar and a fund would leave you after the years that you expect to stay in your home. The catch-up dates above show how long solar can take to catch up.
