In 2025, my DIY solar system saved me £1,668 — and my net electricity bill for the year was a £74 credit. The grid paid me. On a £9,000 investment, that is a 5.4 year payback period and an 18.5% annual return, tax-free. If you are just starting out, my beginner’s guide to home solar covers the fundamentals. This article shows you what happens when the system is up and running.
2025 Results: £1,668 Saved From a 7 kWp DIY System
This is the first full calendar year with my expanded system — 7 kWp across two arrays (4,372 kWh from the Sunsynk hybrid inverter, 1,700 kWh from microinverters). Total generation: 6,072 kWh.
Where the Money Comes From
| Income Stream | How It Works | 2025 Amount |
|---|---|---|
| Avoided grid costs | 2,031 kWh used directly at home instead of buying at 29.62p/kWh | £634 |
| Battery arbitrage | Charge battery overnight at 8.5p/kWh, discharge during the day at 29.62p/kWh — saving 21.12p per kWh | £447 |
| Export earnings | 3,914 kWh sold to the grid at 15p/kWh via Octopus export tariff | £587 |
| Total annual benefit | £1,668 | |
My total electricity bill for 2025 — import costs plus standing charges — came to £513. Against £587 in export earnings, that left me with a net credit of £74. Electricity effectively cost me nothing for the entire year.
Payback Period: 5.4 Years
With £1,668 in annual benefit against a £9,000 system cost, the simple payback is 5.4 years. Cumulative benefit through 2025 stands at £2,729 (including partial returns from 2023-2024 before the expansion). Break-even is projected for 2028-2029.
Even with conservative assumptions for 2026 — 10% less generation from weather variance, 5% battery degradation, 5% higher consumption — the projected annual benefit is still £1,572. The system is firmly on track.
Solar Panel Returns vs ISA, Stocks and T-Bills
In 2025 my £9,000 system returned £1,668 in combined savings and export income — an 18.5% annual return, tax-free. How does that compare to traditional investments?
Be Honest About Stocks: They Can Beat Solar — Or Lose Everything
Let me be upfront: if I had put that £9,000 into NVIDIA in mid-2023, I would be sitting on a much larger sum right now. Anyone who claims solar always beats the stock market is not being straight with you.
But here is the other side of that coin. Individual stocks can also go to zero. Entire sectors can collapse. The FTSE 100 lost 30% in the 2020 crash and took over a year to recover. If you had needed that money during the drawdown, you would have locked in real losses. My solar panels, meanwhile, kept generating electricity through every market wobble, every recession headline, every rate decision. They are physically bolted to my roof, producing value every day the sun comes up. No stock does that.
So the fair comparison is not solar vs your best stock pick with hindsight. It is solar vs other low-risk, predictable-return options where your capital is not at risk of disappearing:
- Cash ISA (4-5% in 2026): £9,000 at 5% = £450/year. My solar returned £1,668 in 2025 — nearly four times more, and also tax-free.
- UK T-Bills (4-4.5%): £9,000 in gilts yields roughly £360-405/year before tax. After basic-rate tax that drops to £288-324. Solar delivered £1,668.
- FTSE 100 / S&P 500 (long-term ~7-10% average): Higher potential returns over decades, but with real years of negative performance along the way. Solar returns are always positive. You will never open your inverter app to find your panels lost 20% overnight.
For a deeper analysis of payback periods, property value impact, and whether solar makes sense for your situation, see our comprehensive guide: Are Solar Panels Worth It in 2026?
The Portability Trade-Off
There is one clear disadvantage: if you sell your home, you keep your ISA but the solar panels stay behind. However, this is not the loss it first appears. Solar panels add an estimated £7,000-10,000 to your property value and improve your EPC rating, which helps sell faster. You are not losing the investment — you are converting it into property equity.
Meanwhile, the ISA advantage of portability comes with a catch: your 5% return will never beat 27p/kWh electricity inflation. Energy prices have a structural upward trend that cash interest rates rarely match over the long term.
The System: From 3.87 kWp to 7 kWp
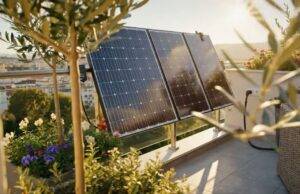
I started in 2023 with a 3.87 kWp solar panel system on my garage roof, which faces both east and west due to the pitched design. In May 2024, I expanded by adding another 3.2 kWp of panels with microinverters, bringing my total capacity to 7 kWp.
The Investment: Breaking Down the Costs
My total investment was around £9,000. This includes:
- Equipment Costs: Solar panels, inverters, batteries, and mounting hardware.
- Tools: Specialized equipment needed for installation.
- Professional Services: Certified electricians for the grid connection and compliance.
- Registration Fees: Registering for energy export with Octopus Energy.
If you are considering a similar system today, you would likely pay less — component prices have dropped roughly £1,783 since I purchased in 2023, primarily for solar panels and inverters.
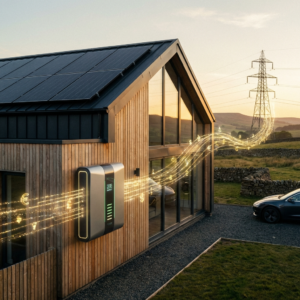
My system is grid-tied, working in conjunction with the national grid. I cover the full DIY installation process in a separate article.
Home Solar Return On Investment And Savings Calculator
Use this calculator to see how much you can save yearly by generating electricity from solar panels. It can help you calculate the ROI (return on investment) of your home solar energy system.
Solar Savings Calculator
The calculator is simplified to maximise the usage of your solar panels generation. In reality to do that you need a battery. For simplicity, the battery section in this calculator is for savings with a flexible tariff.
The model is based on over 2.5 years of real generation, export and flexible tariff data from my own home solar energy system. Watch this video for more details:
Understanding How the Solar Savings Calculator Works
This solar savings calculator estimates your potential savings from solar panels by considering key factors related to your energy use and solar generation. You start by selecting your estimated annual consumption (using UK averages) or entering your exact usage. We then calculate how much of your consumption can be met with solar power, considering different months of the year, and factor in how much energy would need to be imported from the grid.
Key assumptions baked into this calculator include:
- Seasonal Variation: We distribute both energy consumption and solar generation across the months of the year using average seasonal patterns. Winter months generally have lower solar generation, while summer months have higher production.
- Battery Usage: If you select a battery, we assume that 80% of its capacity is usable. The calculator also considers flexible pricing—charging the battery at night when rates are lower and using it during the day when rates are higher. However, there is a cap: the battery benefit cannot exceed the gap between your solar production and consumption.
- Static Prices: Enter your energy import, export, and night rates. These are assumed to stay constant throughout the year, simplifying the model but may not capture fluctuations in actual market prices.
Limitations to keep in mind:
- Simplified Monthly Distribution: Monthly energy usage and generation are distributed using average percentages. This means the model does not consider daily changes, weather conditions, or unique seasonal fluctuations for your location.
- No Dynamic Price Modeling: We do not account for variations in energy tariffs or future increases/decreases in energy prices, which can impact the accuracy of the projected savings.
- Battery Efficiency: The battery efficiency is estimated, meaning the actual energy stored and used could differ based on specific battery models or environmental factors.
Despite these assumptions, I believe this calculator offers a good approximation of savings because it uses realistic seasonal distributions. I based this on my actual usage statistics across multiple years. The calculator also incorporates both generation and storage capabilities.
While it won’t capture every nuance of your specific energy situation, it provides a valuable baseline for understanding how solar panels, potentially combined with battery storage, can reduce electricity costs and export benefits. It’s a helpful way to see how solar energy can fit into your home’s energy needs and give you a clearer picture of what to expect.
The First 16 Months: How It All Started
Before the expansion, my original 3.87 kWp system ran for 16 months from mid-2023. Those early results already showed solar was a sound investment:
- Bill savings from direct solar use: £858
- Export earnings (from November 2023): £284 at 15p/kWh via Octopus export tariff
- Battery arbitrage savings: £200 from charging overnight at cheap rates and using stored energy during the day
- Total: £1,342 — pointing to an 8-9 year payback on the smaller system
The battery arbitrage strategy was an unexpected bonus. Charging at cheaper nighttime rates and discharging during the day turned winter months — when solar generation is low — from a write-off into a profit centre. That early success is what convinced me to expand the system in May 2024.
What Comes Next
The shift towards electric heating — heat pumps replacing gas boilers — will increase my electricity needs, making the solar setup even more valuable. I plan to continue expanding:
- More panels: Additional capacity via microinverters where roof space allows.
- More battery storage: Larger Fogstar battery racks to capture more off-peak savings.
- Better tariffs: An EV tariff with even lower nighttime rates could push battery arbitrage savings further.
Final Thoughts
From £1,342 over the first 16 months to £1,668 in a single year — the returns have only improved as the system expanded and I learned to optimise battery usage and tariff selection. The payback period has shortened from 8-9 years to 5.4, and the system now earns more from the grid than I pay into it.
For anyone who wants similar savings without the DIY work, Octopus Zero Bills is worth understanding. It is a different approach with different trade-offs, but it targets the same outcome: dramatically lower energy bills.
If you are considering solar, the numbers speak for themselves. The technology is cheaper than when I started, the tariffs are more generous, and the real-world returns comfortably beat any savings account or bond. This is the article I wish I had read before starting my solar journey — I hope it helps you start yours.