
Solar panel output by month in the UK varies far more than the annual figure suggests. A reasonably unshaded south-facing system may generate roughly 950-1,000 kWh per kWp over a year, but June and July normally provide the most electricity. December provides the least, and output remains low from November through February.
That seasonal swing matters when you estimate winter bills or choose a battery. Annual generation can tell you whether a system is productive overall. It cannot tell you whether the panels will cover your evening consumption in January, or how much surplus you may have on a long June day.
The figures on this page use the European Commission Joint Research Centre’s Photovoltaic Geographical Information System (PVGIS) as the reference method. PVGIS estimates monthly and annual output from long-term solar radiation and climate data. Your roof, location, shading and system losses will change the result.
How much electricity do solar panels generate each month in the UK?
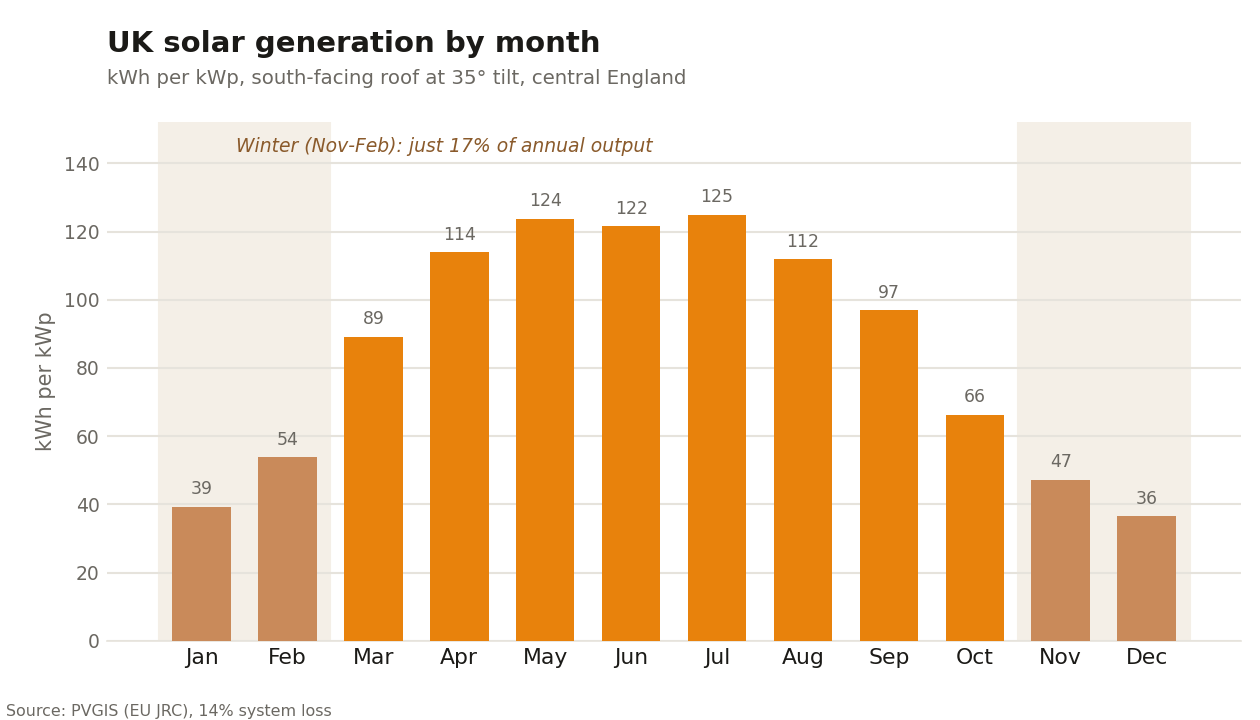
UK solar output rises quickly through spring, normally reaches its highest monthly level in June or July, and falls through autumn. The table below uses PVGIS PVcalc figures for a 1 kWp south-facing system at 35 degrees tilt in central England (latitude 52.3, longitude -0.72), with a 14 percent system loss. Your own location, roof angle and shading will shift the numbers, but the seasonal shape holds.
| Month | Output (kWh/kWp) | Share of year |
|---|---|---|
| Jan | 39.3 | 3.8% |
| Feb | 53.8 | 5.2% |
| Mar | 89.1 | 8.7% |
| Apr | 113.9 | 11.1% |
| May | 123.8 | 12.1% |
| Jun | 121.6 | 11.9% |
| Jul | 124.9 | 12.2% |
| Aug | 111.9 | 10.9% |
| Sep | 96.9 | 9.5% |
| Oct | 66.3 | 6.5% |
| Nov | 47.2 | 4.6% |
| Dec | 36.5 | 3.6% |
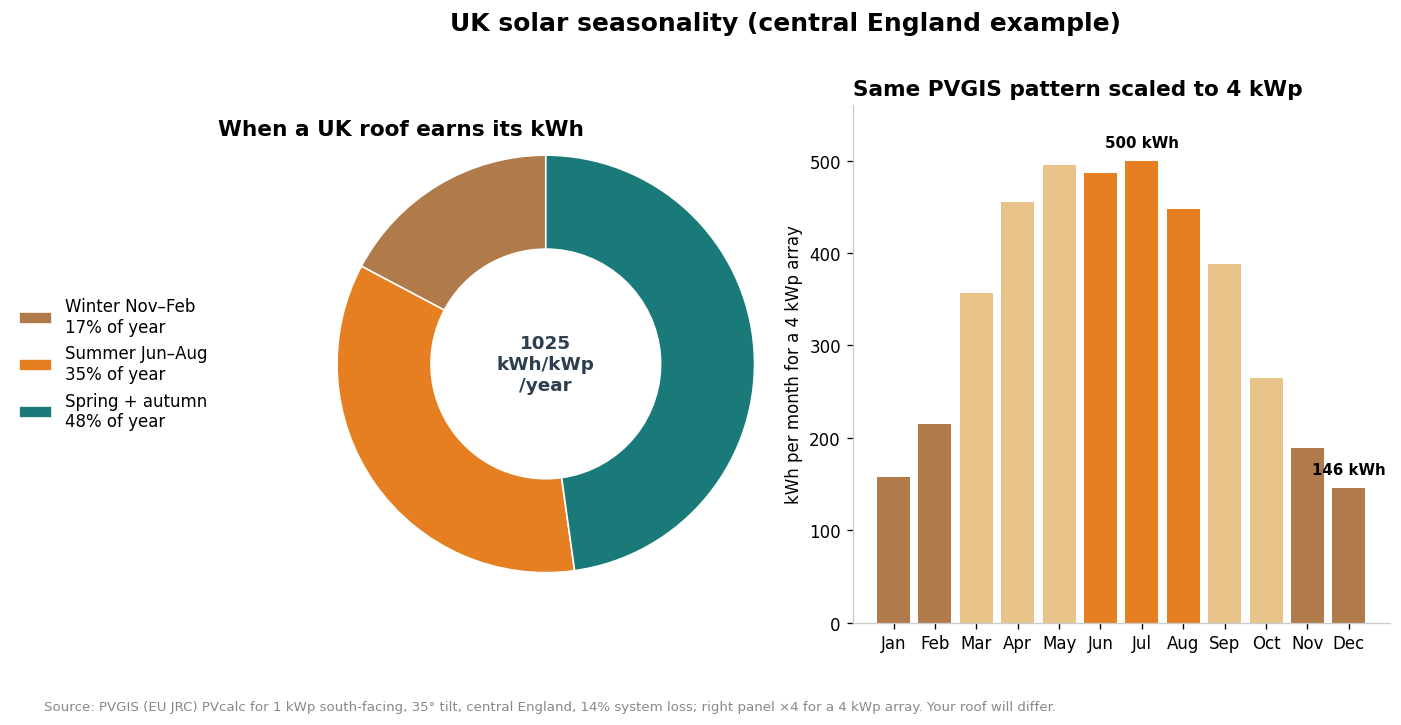
Output per kWp makes the pattern usable across different system sizes. To scale the table to your own roof, multiply the monthly value by your array size in kWp. A 4 kWp system, for example, produces four times the figure shown. This is an energy estimate, not the highest power the inverter may produce at one moment.
The annual total is still useful as a sense check. The central-England example in the table above totals about 1,025 kWh per kWp for the year, and 950 to 1,000 kWh per kWp is a reasonable broad expectation for a well-positioned south-facing UK roof. Neither figure is a guarantee. Northern locations, shading, a different roof direction and system losses can all pull the result away from that range.
How much do solar panels generate in winter in the UK?
Solar panels still generate electricity during a UK winter, but November to February produce only a small fraction of the energy available in summer. December is normally the lowest month. As a daily comparison, an average December day produces only about 29% as much energy as an average June day, using the monthly figures in the table above.
The panels do not stop working because the air is cold. The problem is the solar resource available to them. Winter brings fewer daylight hours, a lower sun and more frequent cloud. The low sun also makes nearby trees, chimneys and roof features more likely to cast long shadows across the array. In my own system, the fall from summer into a dark December matches the shape in the table above: the hardware keeps generating, there is just far less daylight for it to convert.
This is why an annual estimate can create the wrong expectation. Your system may generate enough electricity across the full year to match a large part of your annual household use, while still importing heavily during winter evenings. Summer surplus does not cancel a January import on the electricity meter unless the tariff accounts for the export financially.
I would not size a system on the assumption that it will make a home independent through winter. Instead, treat winter generation as useful bill reduction when it arrives. Design the array around the roof space, annual economics and realistic consumption, then plan separately for winter imports.
Why does UK solar output change so much between winter and summer?
The seasonal difference comes mainly from daylight length, the sun’s height and weather conditions. Longer summer days give the array more generating hours. A higher sun also puts stronger light onto a suitably angled roof and reduces many nearby shadows. Panel temperature affects efficiency, but it does not outweigh the extra summer sunlight.
Roof direction changes when the electricity arrives as well as how much arrives. A south-facing array concentrates more production around the middle of the day. The 2-bed south-facing roof guide shows how that profile affects a smaller household. An east-west roof tends to spread generation more broadly across the morning and afternoon.
Angle matters because the sun’s position changes through the year, but there is no single angle that makes winter behave like summer. Use the solar panel angle calculator to compare roof slopes for your location. This page remains the seasonal reference rather than duplicating that calculator.
What does monthly solar output mean for battery sizing?
A home battery moves electricity from one part of the day to another. It can store a sunny afternoon surplus for the evening, but it cannot carry June generation into December. Monthly output therefore matters because a large battery may fill regularly in summer yet receive little spare solar energy on many winter days.
Size the battery against the surplus you can produce and the electricity you use after generation falls away. Do not size it by dividing annual solar output by 365. That approach invents an average day which rarely exists in the UK. The home battery overview explains capacity, usable energy and the difference between storing solar and charging from the grid.
A larger battery can still have a winter role if you charge it on a suitable time-of-use tariff. That is a tariff decision rather than evidence of higher winter solar output. Keep the two calculations separate: first estimate how much solar is available each month, then decide whether tariff charging changes the battery economics.
How should you estimate solar panel output for your own roof?
Use PVGIS with your postcode or map location, installed capacity, roof slope and azimuth. Keep the loss assumption visible and include the horizon where appropriate. The result gives a monthly estimate based on long-term weather records, not a promise for next year. Compare actual generation with it only over a sensible period.
- Location: use the actual property rather than a UK midpoint.
- Installed capacity: enter the panel array’s rated capacity in kWp.
- Roof direction: enter the azimuth correctly. South is the PVGIS reference direction, not a compass bearing copied without checking the tool’s convention.
- Roof angle: use the actual pitch rather than automatically selecting the optimum.
- Shading and losses: account separately for local obstructions that the model cannot represent accurately.
PVGIS reports monthly average energy output calculated from a multi-year solar radiation and climate record. Real months will move around that estimate. A clear February can beat the model, while a dull July can fall short. Faults, dirt, snow, inverter clipping and new shading can also create differences which weather alone does not explain.
When judging whether the full installation makes financial sense, use those monthly estimates alongside your actual consumption and tariff. The guide to whether solar panels are worth it covers the wider calculation. Generation has value only when you know how much will be used, stored or exported.
How can you estimate this for your own roof?
Start with a PVGIS monthly estimate for your exact roof, then compare it with twelve months of household electricity use if you have the data. Treat winter imports as normal, test battery capacity against daily surplus, and keep the annual yield as a cross-check rather than spreading it evenly across every month.
If you are still deciding what information to gather, begin with the Solar Energy Concepts start-here guide. It will help you move from roof and consumption details to a system that reflects when your home uses electricity, not just the largest annual generation number in a quotation.
