
A home battery loses about 2 to 3% of its capacity a year. That is the average that researchers measured on 21 home batteries in Germany over up to eight years. My own three battery packs tell a similar story. After three and a half years, their screens show 87 to 89 Ah, against a rated 100 Ah. Over the last two years of readings, that is a loss of about 3.3% a year.
The catch is that those screen numbers are estimates, not measurements. Below, I go through every reading I took, what it can and cannot tell you, and what it changes when you buy or size a home battery.
I walk through all of these numbers in this video. It covers the screens, the research, how my use of the battery grew, the upgrade from two packs to three, and what I would buy today.
How much capacity does a home battery lose each year?
The best independent answer comes from a field study, Figgener et al., published in Nature Energy in 2024. A team at RWTH Aachen University measured 21 home batteries in German homes from 2015 to 2022. Every battery worked alongside solar panels. On average, the batteries lost “about two to three percentage points of usable capacity per year”.
The study tested the batteries in the field, not only through their own screens. In those capacity tests, the lithium iron phosphate (LFP) systems lost 2.2 percentage points a year. My packs use LFP cells too.
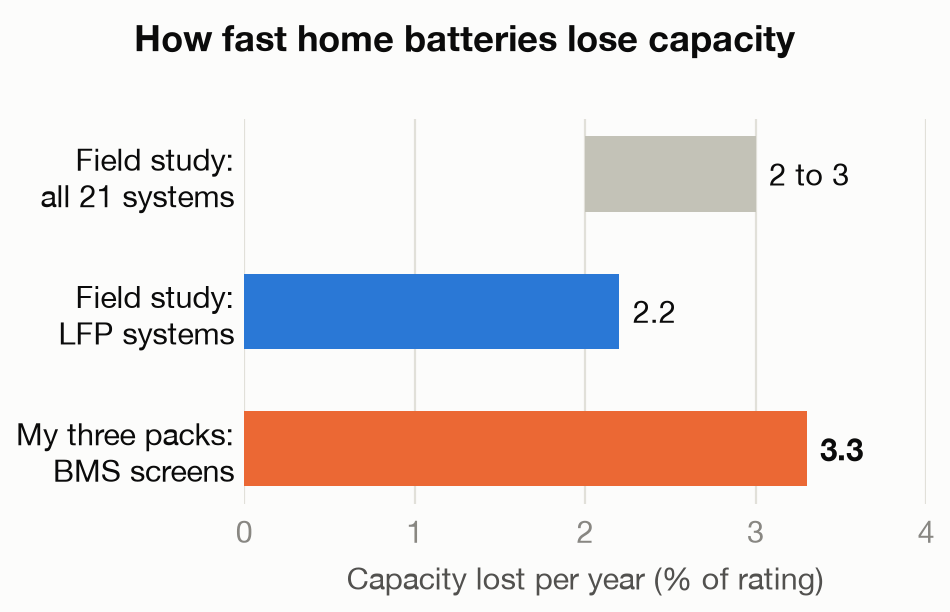
My three packs show 3.3% a year on their screens. I measured that over the two years from September 2024 to September 2026, which covers two winters and two summers. All three packs lost between 6.7 and 6.8 Ah in that time.
So my battery seems to wear about 1.5 times as fast as the average LFP battery in the study. It does not wear nearly four times as fast, which is what the cycle rating first suggested to me.
The study also gives a sense of when a battery reaches the end of its life, which it defines as 80% of the rated capacity. “After 7 years, the first end of life (EOL) cases can be identified.” A few tests showed slightly less than 80% after only 4.5 years. Other systems still showed good capacity after the same time.
What do my battery screens show after three and a half years?
My battery is three Fogstar rack packs behind a Sunsynk 3.6 kW hybrid inverter. Each pack holds 100 Ah at 51.2 V, which is 5.12 kWh. Together they make 15.36 kWh. Two packs have been in my rack since May 2023. The third pack worked alone in another home for 16 months, and joined my rack in September 2024.
Each pack has its own battery management system (BMS) with a small screen. Three numbers on that screen matter:
- Capacity is the charge the pack holds when it is full, in amp-hours (Ah). New, my packs showed 100.00 Ah.
- State of charge is how much of that capacity is in the pack now, as a percentage.
- Cycles counts how many times the pack has given out about one full capacity, even when that happens in many small discharges.
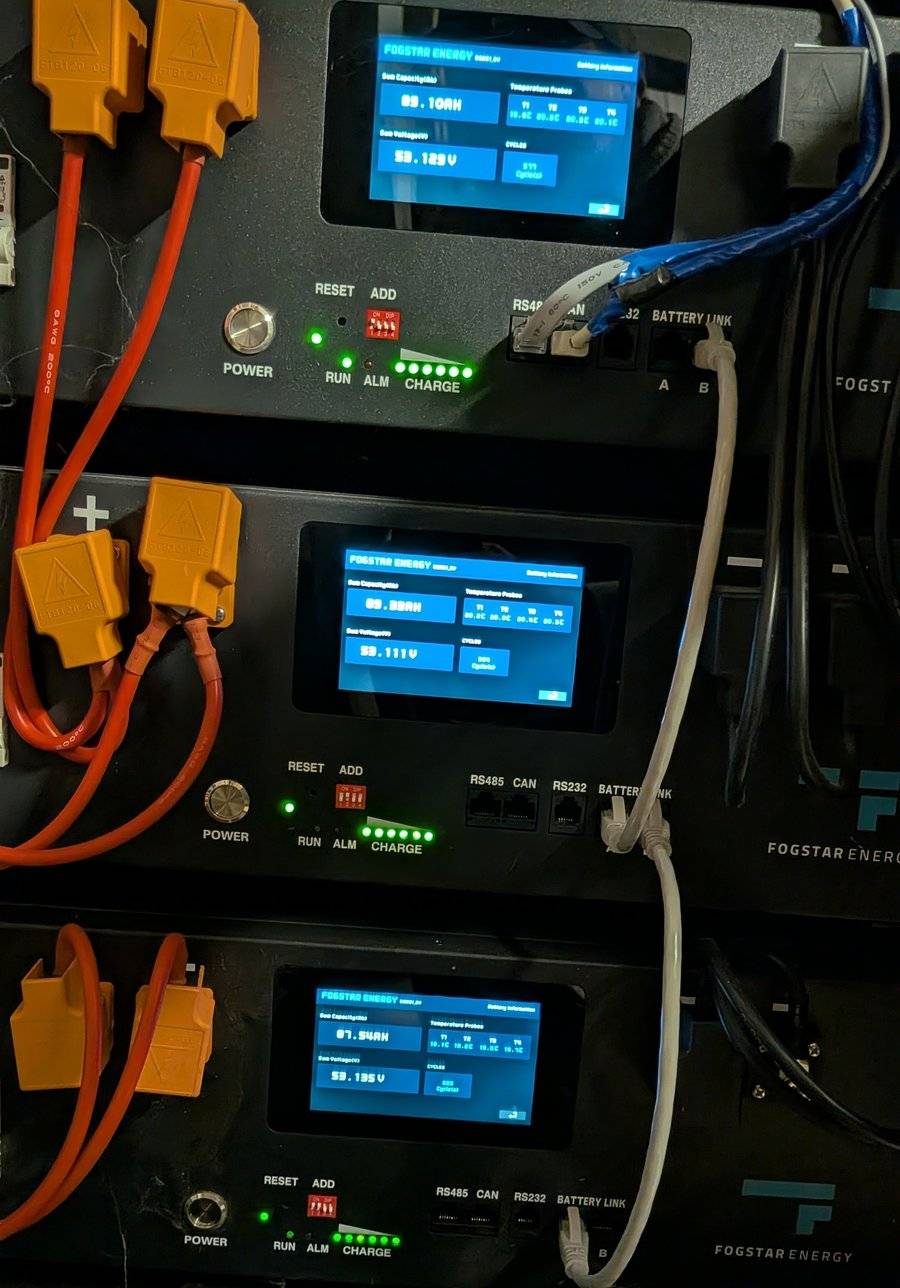
I photographed the screens on five days between August 2024 and October 2026. On the first day, only my two original packs were in the rack. On 26 October 2026, the packs showed 88.74 Ah, 88.95 Ah and 87.17 Ah. That is 11 to 13% below the rating.
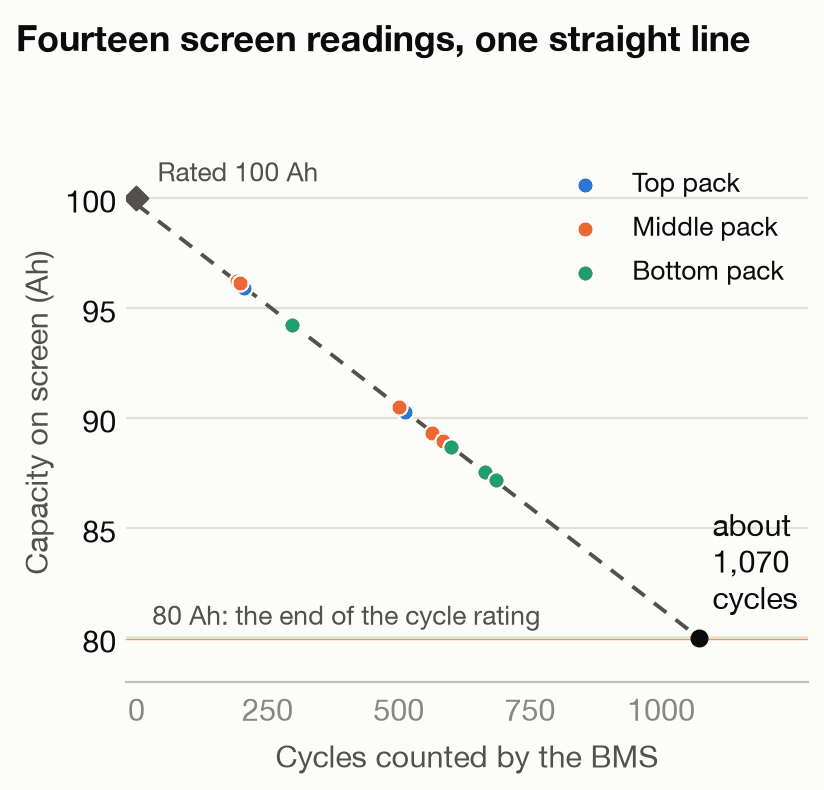
The surprise came when I plotted capacity against the cycle count instead of the date. All fourteen readings from all three packs fall on one straight line: capacity = 99.71 Ah minus 0.0184 Ah for each counted cycle. No reading misses the line by more than 0.06 Ah.
The third pack shows the lowest capacity, but it is not a weaker pack. It sits on the same line, about 95 cycles further along, because it worked alone for 16 months. At 0.018 Ah a cycle, 95 extra cycles explain its whole 1.7 Ah gap.
Can you trust the capacity number on a battery screen?
Only partly. The researchers make the same point: customers “have to rely on the given values of battery management systems (BMSs), which have unknown calculation schemes”. Nobody has run a capacity test on my packs, so every Ah figure above is the BMS’s own estimate.
A BMS cannot read the charge in an LFP pack from its voltage. An LFP cell holds almost the same voltage across most of its charge. In my rack, 3.276 V per cell meant 39 to 50% charge, and 3.337 V meant 92 to 95%. So 56 points of charge fit inside 0.06 V.
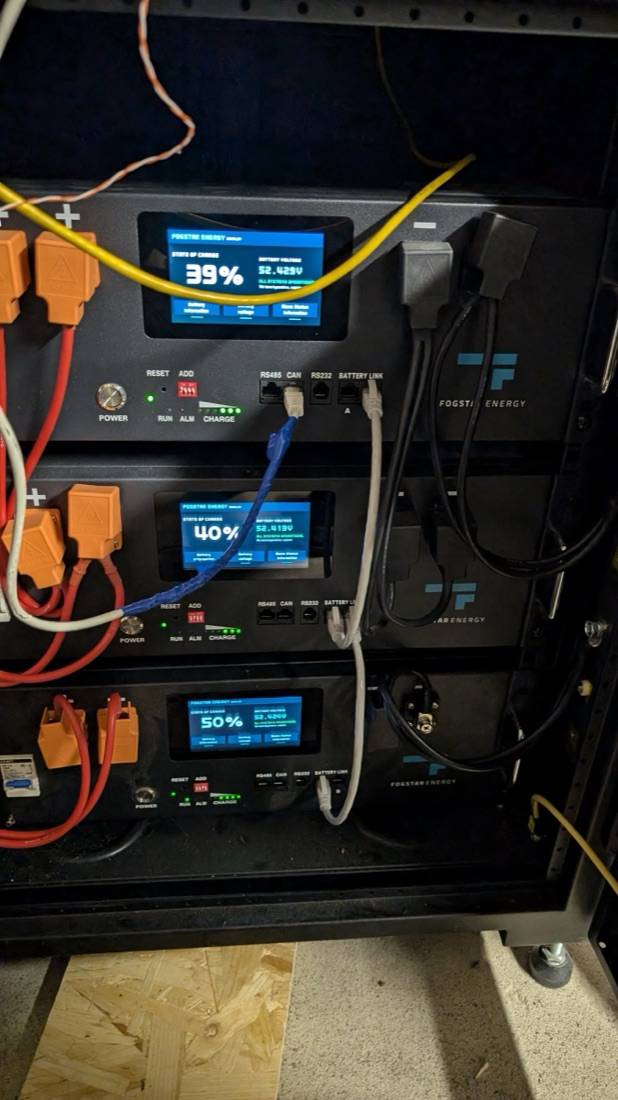
The BMS counts the current in and out instead, starting from the last time it saw a full pack. Errors build up between full charges. This photo shows the result. On 5 September 2024, all three packs sat at the same 52.4 V, but their screens showed 39%, 40% and 50%.
One screen number does pass an independent check. My inverter measures the energy that leaves the battery with its own sensor. In the three periods where the cycle counter ran without a break, each counted cycle matched 4.2 to 4.3 kWh out of the battery. One pack holds 4.6 to 4.9 kWh, so one count is a little less than one full pack. So the cycle counter agrees with the inverter’s meter. That check assumes that my rack was the first battery on this inverter, which the inverter’s history supports.
The capacity figure is harder to believe. A straight line this clean suggests that the BMS calculates capacity from the cycle count, rather than measuring it. Per cycle, my screens take off 1.83 points of capacity for every 100 cycles. The study’s LFP systems lost 0.7 points per 100 full cycles. A count is a little less than one full pack, so this comparison is rough. Even so, if my BMS is pessimistic, this is where it shows.
Treat your own battery screen the same way. Use it to compare packs and to see a trend over time. Do not treat a single reading as a measured capacity.
Do home batteries wear out with cycles or with years?
Both. A lithium cell loses capacity when you use it (cycle ageing) and while it simply sits there (calendar ageing). Heat and long periods at a high state of charge speed both up, as lab work on LFP cells by Schimpe and colleagues shows.
My screens show only the cycle part. From March to September 2026, my battery did about half as many cycles a day as in the 18 months before. The screens then lost half as much capacity a day, but almost exactly the same amount per cycle.
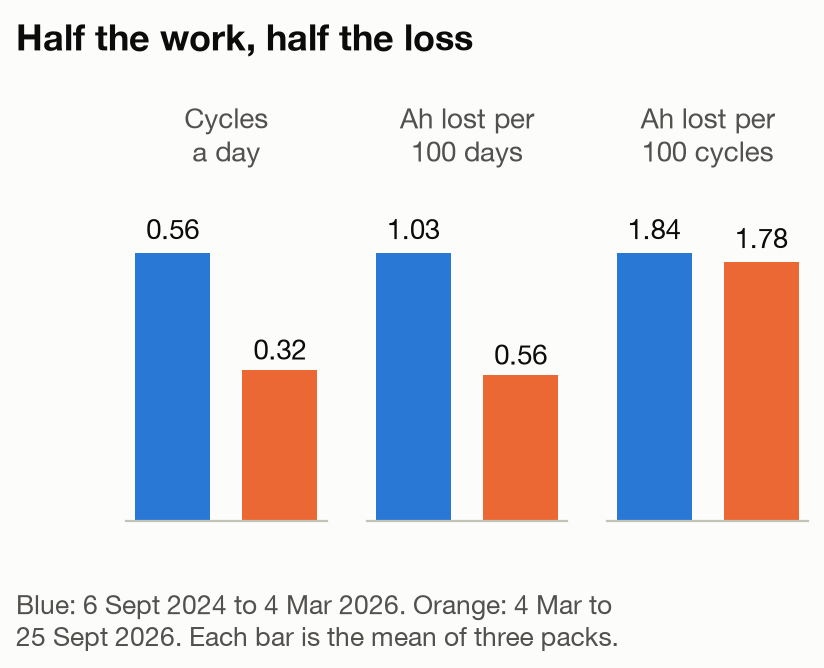
This matters because cycle ratings say little about a home battery’s life. When I measured my packs, Fogstar rated them for 4,000 cycles at 1C to 80% capacity. 1C means a full charge or discharge in one hour. A lab can run 4,000 such cycles in about a year, so calendar ageing has little time to act in the test.
A home battery works much more gently. My whole rack may discharge at most 75 A, so each pack gives about a quarter of the test current. My packs count about 0.49 cycles a day. At that pace, 4,000 cycles take 22 years, and calendar ageing acts on the cells for all of that time.
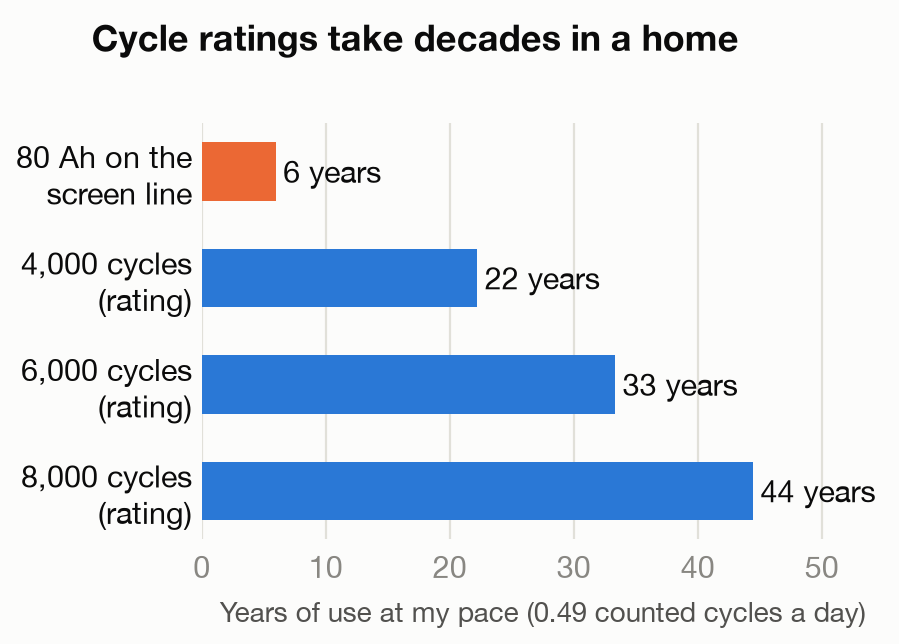
So read a battery’s life in years, not in cycles. On my screens’ line, my packs reach 80 Ah between January and July 2029, about six years after I bought them. That is close to the seven years at which the study saw its first end-of-life cases.
Ratings also change. On 31 October 2026, the same Fogstar product page said “5,000 cycles at 95% Depth of Discharge (DOD)” and no longer stated the capacity at the end of those cycles. None of the four cycle ratings that I read from current home battery pages stated that end capacity.
What happens when a battery reaches 80% of its capacity?
Nothing switches off. 80% is where a cycle rating stops counting, not where the battery stops working. The inverter charges and discharges within the limits that the BMS reports, so the usable kilowatt-hours simply get smaller.
You also never get the full rating. The inverter keeps a reserve in the battery to protect the cells and to keep power for the house. My settings keep 15% overnight and 18 to 23% during the day, so about 20% of the battery never reaches my home.
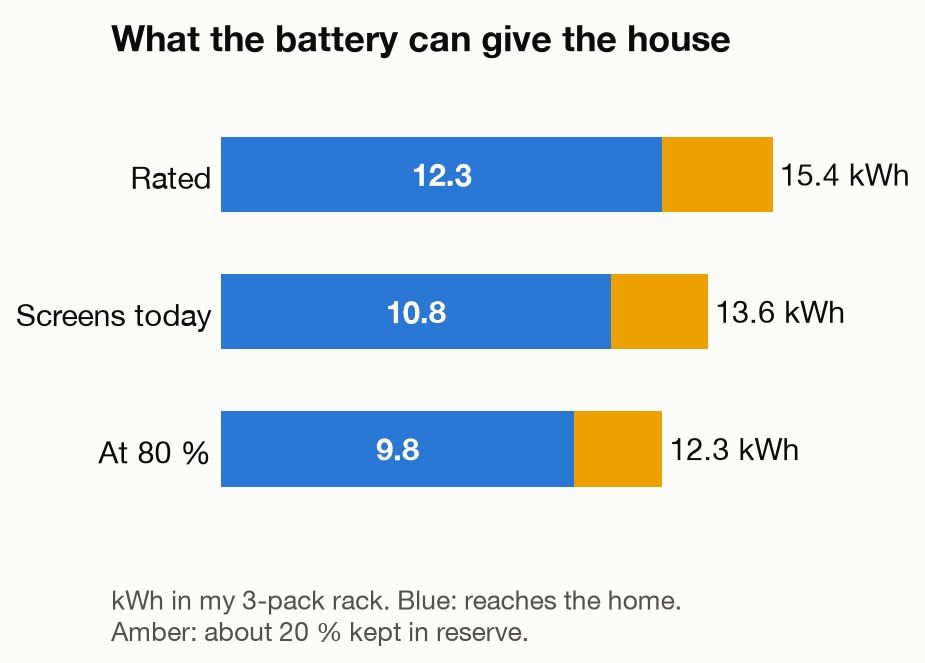
At 80%, my three packs still hold 12.3 kWh. That is more than two new packs held when I started. The real risk is different: wear can speed up near the end of life. The study notes that “both linear and nonlinear ageing behaviour are possible”, although it did not yet see a clear knee point in its systems.
Why did 10 kWh of storage stop being enough?
I bought my first two packs, 10.24 kWh, from my own estimate of what the house would need after sunset, and from my budget. It took one winter to show that I needed more.
In my first winter with the battery, my panels made only 1.3 to 3.6 kWh a day from November to February. The house used about 17.5 kWh a day. I wanted to run the whole day from the battery, and two packs could not do it. The reserve took away another 20% of what I thought I had.
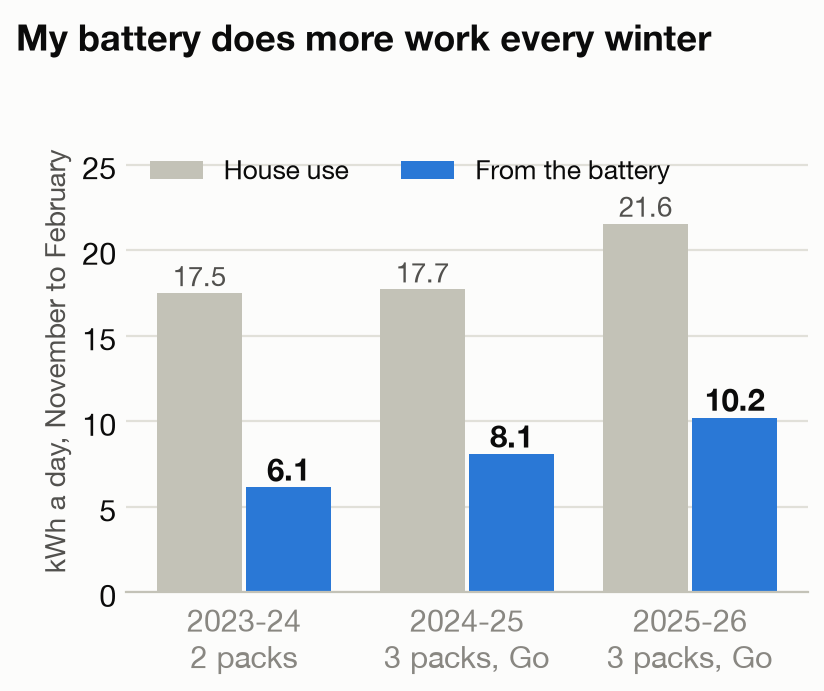
Then my use of the battery grew every winter. The battery gave the house 6.1 kWh a day in winter 2023 to 2024, 8.1 kWh in the next winter and 10.2 kWh in the last one. Part of that growth is the third pack and the cheap overnight rate. Part of it is a house that uses more, because cheap stored energy changed how we live.
How I added the third pack
The third pack came from the same 2023 bundle as my other two, so it is the same make and model. It joined my rack in September 2024, after 16 months in another home. Before I connected it, Fogstar support told me that “only identical batteries can be connected”. Its product page also rules out other makes and models, and it says that the packs “cannot be connected in series”.
Mixing brands is not impossible, but it needs knowledge and equipment that most homeowners do not have. Matching chemistry is not enough. The cells, the BMS and the firmware must also work together.
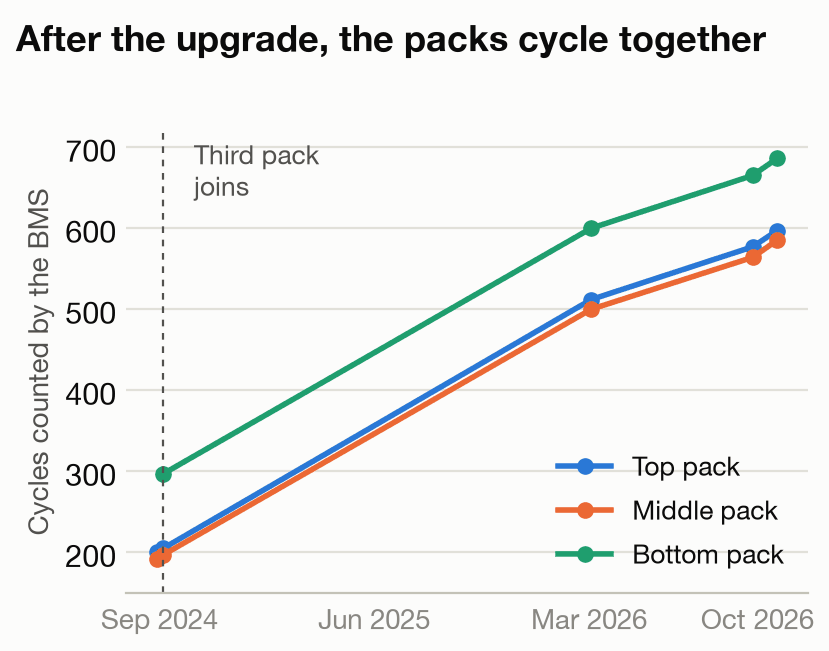
When the third pack joined, my two packs had counted about 200 cycles and the new one 297. Since then, all three have counted cycles at the same rate. The gap stayed at about 95 cycles.
Hire a qualified electrician for this work. Connecting a pack to a live battery bank is dangerous. The new pack must match the cell voltage of the others within a set range. The inverter has limits on how many packs it can take, and parallel and series connections behave very differently. If you are unsure, do not do it yourself.
How much does a battery add to your savings?
Since November 2024 I have been on Octopus Go. The battery charges from the grid overnight at the cheap rate, and the house runs from it during the day. That frees almost all of my solar for export.
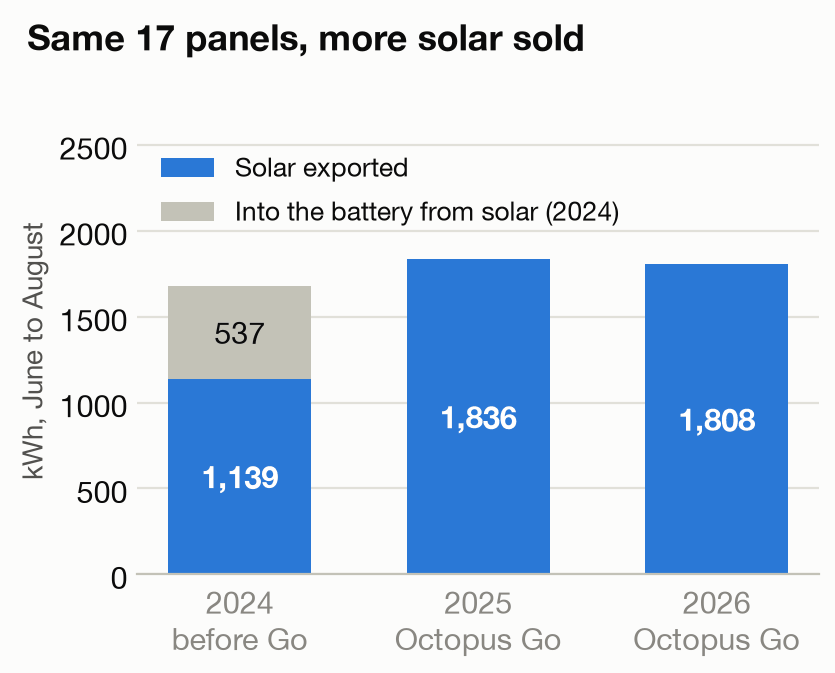
With the same 17 panels, I sold 1,139 kWh from June to August 2024. I sold 1,836 kWh in the same months of 2025, which is 61% more. Most of that gain is the battery’s new job. In summer 2024, before Octopus Go, 537 kWh went into the battery, and I charged it from solar at that time. On Octopus Go, the battery charges from the grid at night and that solar goes to the grid instead.
In 2025 my solar and battery together were worth £1,623.50 to my household. The battery’s share was £435, or 27%. That figure already takes off the cost of the cheap electricity, at 8.5p a unit, and the energy lost going in and out of the battery. Over its life, my inverter has taken back 87.5 kWh for every 100 kWh it put into the battery.
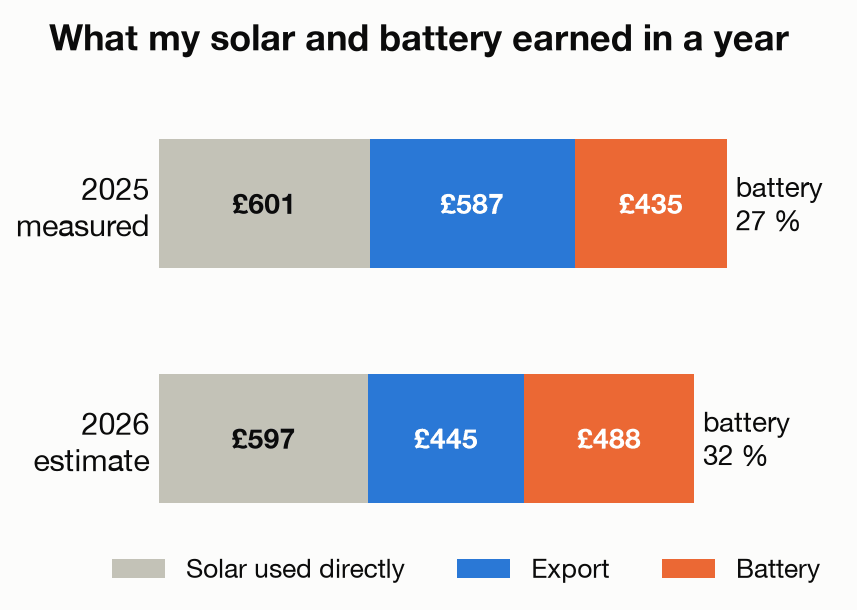
In March 2026, my export rate fell from 15p to 12p a unit. My estimate for 2026 puts export at £445 and the battery at £488, which would make the battery nearly a third of the total. When export pays less, storing your own energy matters more.
A battery also earns without any solar. In our model of a home that uses 12 kWh a day with no panels, a 16 kWh battery on Octopus Go cut the yearly bill from £1,426 to £623. That is a model, not my home, but it shows that the battery is the part that does the work on a time-of-use tariff.

What home battery would I buy today?
Knowing what my screens now show, I would change three things about how I bought my battery:
- Go much bigger than you think you need. I estimated about 10 kWh a day. Today I would buy at least double, about 20 kWh. Wear and the reserve both take a slice, and at 80% a 20 kWh battery still holds 16 kWh. My use is also still growing, and a heat pump will add the most in winter, when the battery is already short.
- Choose a brand that will still sell the same pack. The easiest upgrade is the same make and model, so I care more about support and a stable product range than about the logo. The exact pack I bought in 2023 was still in stock on 30 October 2026.
- Treat the battery as its own product, not an add-on to solar. A battery on a time-of-use tariff saves money with or without panels. If you can only afford one, I would buy the battery first and buy as big as you can.
Plan the upgrade on day one, too. Leave space in the rack or cabinet, check how many packs your inverter accepts, and keep a record of your screens. The photos I took over two years are what made this article possible.
What my battery data cannot tell you
I want to be clear about the limits of these numbers, because a clean chart can look more certain than it is.
- The real capacity. Nobody has tested my packs. Every Ah number is the BMS estimate.
- How the BMS updates capacity. Pace, the BMS maker, does not publish the rule. The straight line suggests a calculation from the cycle count, but it does not prove one.
- The early history. In late 2023, the cycle counters of my first two packs lost about 147 counts. A reset or a pause in counting both fit the numbers. I have no record of the bottom pack’s early counter.
- The temperature history. My packs read about 20 °C on most of the days I checked, and about 13 °C in March 2026. I have five snapshots, not a log.
- The future. Wear does not stay linear near the end of life, so the 2029 date is a forecast from the screens, not a promise.
Even with those limits, three and a half years of readings give a clear direction. Expect to lose a few percent of capacity a year, size the battery for the house you will have, not the one you have now, and read the screen as a trend.
